

Oracle’s fiscal year ends May 31, so its first quarter of fiscal 2027 covers June to August and closes on August 31, 2026. The company had not announced a report date as of August 19; a data provider projects September 14. At its last results Oracle reported remaining performance obligations of $638 billion and guided to $90 billion of fiscal 2027 revenue.
Data as of August 19, 2026. Figures are historical or previously published and are not a forecast.
When does Oracle report first-quarter results?
Not yet announced, and any page stating the date as settled fact is overstating what is known.
Oracle’s investor-news page carried no first-quarter fiscal 2027 date announcement when checked on August 19, 2026. Two separate things are known, and they differ in kind:
A data provider projects September 14, 2026.[^1] That is an inference from Oracle’s past reporting pattern, not a company statement, and it is superseded the moment Oracle announces.
The quarter itself does not close until August 31, 2026. Oracle’s fiscal year ends May 31,[^2] so its first fiscal quarter runs from June through August. A report in September would follow roughly two weeks after the quarter ends, which is unusually fast and is Oracle’s long-standing pattern.
| Report | Projected date | Consensus EPS | Consensus revenue | Date status |
| Q1 FY2027 | September 14, 2026 | $1.77 | Approximately $19.5bn | Provider projection |
| Q2 FY2027 | December 8, 2026 | $1.93 | Approximately $21.6bn | Provider projection |
| Q3 FY2027 | March 8, 2027 | $2.10 | Approximately $23.7bn | Provider projection |
| Q4 FY2027 | June 8, 2027 | $2.42 | Approximately $26.8bn | Provider projection |
Every row is a projection. Confirm against Oracle’s investor-relations site before relying on any of them.
Why does a fiscal first quarter end in August?
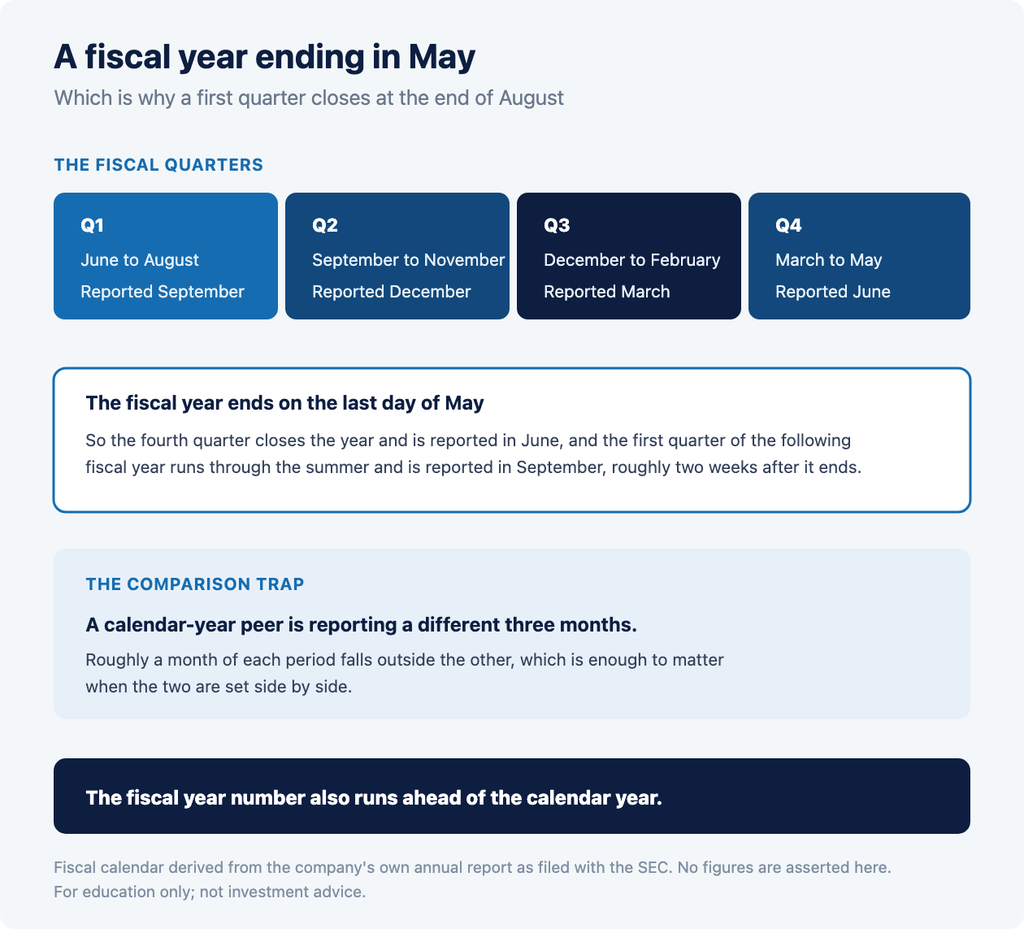
Because Oracle’s fiscal year runs June to May rather than January to December.
Its Form 10-K covers the year ended May 31, 2026.[^2] That places the four fiscal quarters as follows:
| Fiscal quarter | Period covered | Typically reported |
|---|---|---|
| Q1 | June to August | September |
| Q2 | September to November | December |
| Q3 | December to February | March |
| Q4 and full year | March to May | June |
A reader comparing Oracle with a calendar-year company is comparing different three-month windows. Roughly a month of each period falls outside the other, which is enough to matter when the two are set side by side.
What did Oracle report at its last results?
A full-year set of figures, filed with the SEC as an exhibit to a Form 8-K on June 10, 2026.[^3]
| Measure | Q4 FY2026 | Full year FY2026 |
| Total revenues | $19.2bn, up 21% USD | $67.4bn, up 17% USD |
| Cloud revenues (IaaS + SaaS) | $9.9bn, up 47% USD | $34.0bn, up 39% USD |
| GAAP earnings per share | $1.45, up 21% USD | $5.83, up 34% USD |
The company also reported remaining performance obligations of $638 billion at the end of the quarter, up 363 percent year over year and up $85 billion sequentially from $553 billion at the end of the third quarter.[^3]
That $638 billion figure is the number most coverage leads with, and it is the number this article treats most carefully.
What is RPO, and what does it not tell you?
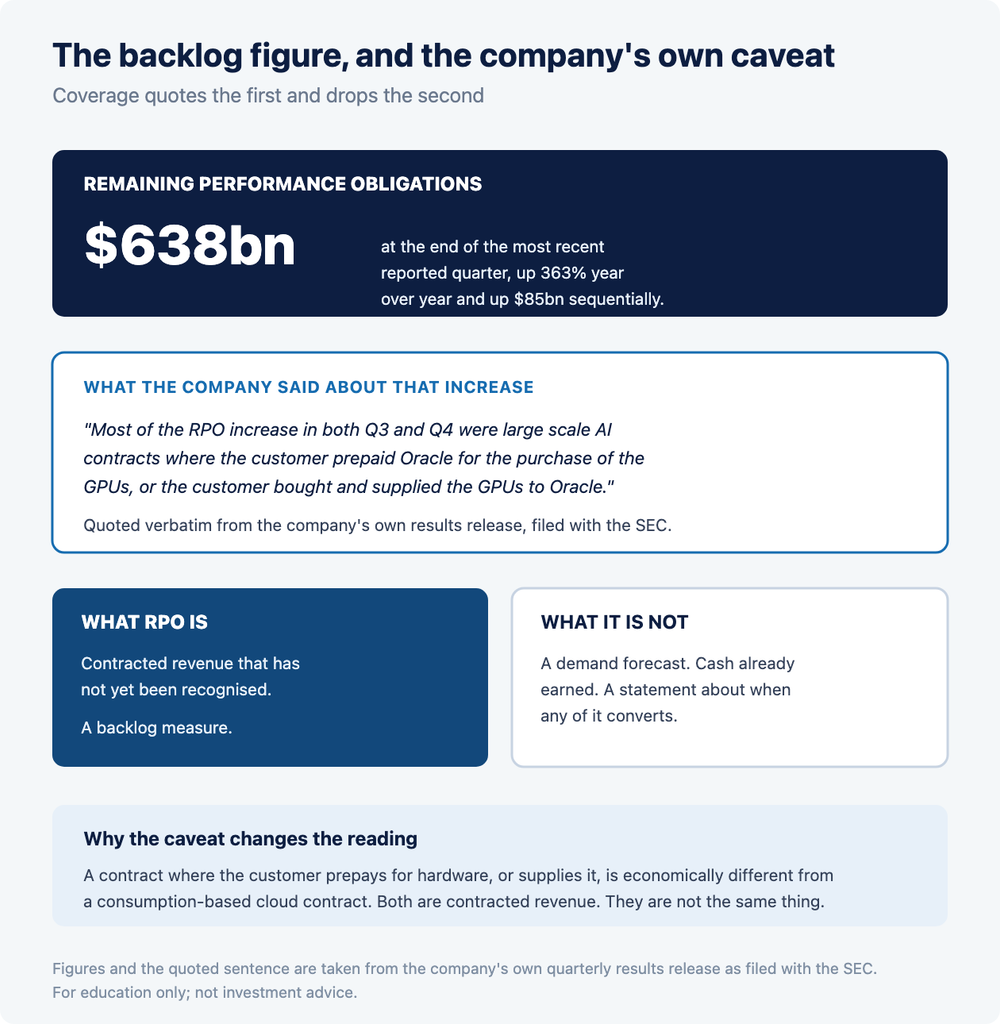
Remaining performance obligations is a disclosure of contracted revenue not yet recognised. It is a backlog measure, not a demand forecast, and Oracle itself has explained why the distinction matters.
The company’s own caveat, verbatim:
> “Most of the RPO increase in both Q3 and Q4 were large scale AI contracts where the customer prepaid Oracle for the purchase of the GPUs, or the customer bought and supplied the GPUs to Oracle.”[^3]
That sentence is doing a great deal of work, and it is Oracle’s, not this article’s.
What the caveat means
A backlog figure treats every contracted dollar the same way. But an arrangement in which a customer prepays for GPUs, or supplies the GPUs themselves, is economically different from an ordinary cloud contract where the provider owns the hardware and bills for consumption over time.
Both are legitimately contracted revenue and both belong in RPO. They do not carry the same margin profile, the same capital requirement, or the same recognition pattern. A reader who reads $638 billion as a straightforward measure of recurring cloud demand is reading past what the company disclosed about how that number was assembled.
Three further limits on any RPO figure
It is a company-defined presentation of a standard concept. The underlying accounting requirement is standard, but how a company describes, aggregates and comments on its backlog is its own. A figure carrying the same label at two companies may not be comparable.
It carries no timing on its face. Contracted revenue not yet recognised says nothing by itself about when it will be recognised. A backlog stretching over many years and one converting within a year would look identical in a single headline number.
A percentage change from a small base is arithmetically large. An increase of 363 percent describes the movement between two figures. It does not, by itself, establish anything about the durability of the level reached.
A backlog is not cash. Contracted revenue not yet recognised has, by definition, not been billed and collected in full. Whether and when it converts depends on the contracts’ terms and on both parties performing over the life of the agreement. Treating a backlog figure as though it were money already earned is the single most common error in reading this kind of disclosure, and the size of the figure here makes the error a large one.
None of this makes RPO uninformative. It makes it a disclosure that has to be read with the commentary the company published alongside it, which is the argument of this section.
What has Oracle guided to for fiscal 2027?
Specific figures, published by the company itself at the same results.[^3]
| Measure | Company guidance |
| Total revenue | $90 billion, prior guidance confirmed |
| Revenue growth | 27% to 29%, constant currency and USD |
| Non-GAAP earnings per share | Raised to $8.05 |
| Financing | Expects to raise approximately $40 billion through a combination of debt and equity, including a previously announced $20 billion at-the-market equity issuance |
The financing line is part of the same picture
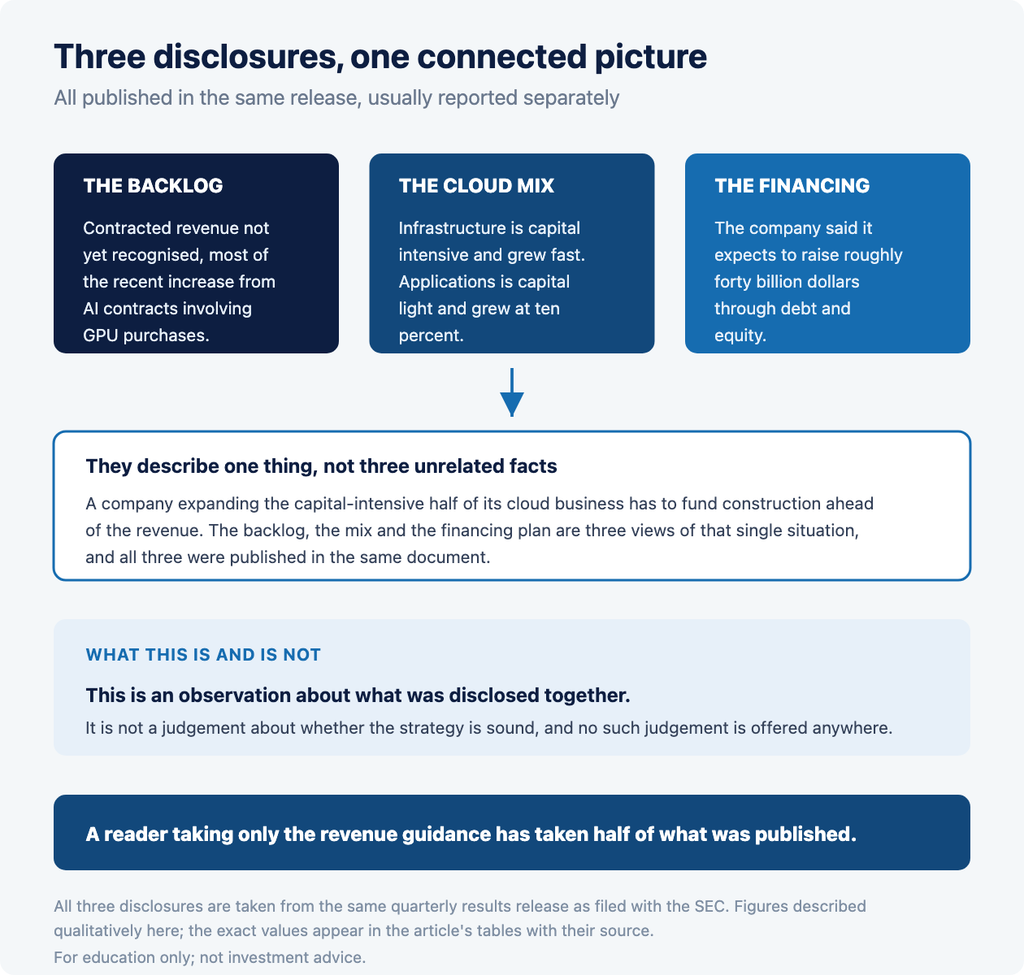
A company guiding to $90 billion of revenue while also stating that it expects to raise roughly $40 billion through debt and equity is describing a business that is funding a build-out, not one throwing off surplus cash. Both statements come from the same release and belong together.
This is reported, not interpreted. The company disclosed both figures, and a reader taking only the revenue guidance has taken half of what was published.
How do the two cloud businesses differ?
Oracle reports cloud revenue as a combined figure covering two quite different businesses, and the release separates their growth rates.
Infrastructure, or IaaS, is compute and storage capacity sold by consumption. It is capital-intensive: the provider builds data centres and buys hardware before revenue arrives, and growth requires spending ahead of it.
Applications, or SaaS, is software sold by subscription. It carries far lower incremental capital requirements, and its growth tends to be steadier because subscriptions renew.
In the most recent full year the two grew at very different rates, with the release citing 10 percent growth in Cloud Applications against a much faster infrastructure rate inside a combined cloud figure of $34.0 billion, up 39 percent.[^3]
Why the distinction matters when reading a single cloud number
A combined figure of “cloud revenue up 39 percent” averages a fast-growing, capital-hungry business with a slower, capital-light one. The same headline could be produced by different mixes of the two, and those mixes have different implications for margin and for how much has to be spent to sustain the growth.
This connects directly to the financing line in Table 4. A company expanding the capital-intensive half of its cloud business is a company that needs to fund construction, which is what the roughly $40 billion financing statement describes.
None of that is a judgement about whether the strategy is sound. It is the observation that three disclosures in the same release, the cloud growth rate, the RPO composition and the financing plan, are describing one connected picture rather than three unrelated facts.
What is a consensus estimate, and why does it differ from guidance?
A consensus estimate is an average of individual forecasts analysts submit to a data provider. It is not a company statement and not a filing.
Providers collect from different analyst panels, apply different rules on stale submissions, and treat adjusted and reported earnings differently. Two providers publishing a consensus for the same quarter can print different figures, and neither is wrong. This article names Finnhub throughout.[^1]
Company guidance and provider consensus are separate quantities produced by different people on different information, and they need not agree. Where they diverge, a single reported figure can be described as clearing one benchmark and missing the other, in the same sentence, without either description being false.
How has Oracle performed against provider estimates?
Mixed, with one outlier large enough to deserve its own caution.
| Fiscal quarter | Period ending | Reported | Estimate | Difference |
| Q4 FY2026 | June 30, 2026 | $2.03 | $2.00 | +1.41% |
| Q3 FY2026 | March 31, 2026 | $1.79 | $1.74 | +3.08% |
| Q2 FY2026 | December 31, 2025 | $2.26 | $1.67 | +35.24% |
| Q1 FY2026 | September 30, 2025 | $1.47 | $1.51 | -2.64% |
Two of the four were small beats, one was a miss, and one was a difference of more than thirty-five percent.
⚠️ Treat that outlier with suspicion rather than excitement. A single-quarter earnings surprise of that magnitude at a company of this size is more often a mismatch in what the provider compared than an operational event. Providers sometimes hold an estimate on one basis and a reported figure on another, and the resulting difference is an artefact of the comparison rather than a fact about the business. Anyone relying on that row should check it against Oracle’s own release for the quarter rather than taking the provider’s percentage at face value.
The broader point stands regardless: a four-quarter record containing a miss, two small beats and one anomaly does not support any claim about what the next quarter does.
What is published on results day, and in what order?
The same sequence each quarter, and knowing it changes where a reader looks first.
A filing. Results are furnished to the US Securities and Exchange Commission on Form 8-K, with the results release attached as exhibit 99.1. That exhibit carries the revenue figures, the earnings figures, the RPO disclosure and the guidance, and it is public on SEC EDGAR the moment it is filed. Every figure in this article came from exactly such an exhibit.[^3]
The release, published simultaneously on the company’s investor-relations site, carrying the same content.
The conference call, at the time the company announces alongside the date.
Why the filing is the better source
Oracle’s investor-relations site returns an access error to automated requests, which is common and unremarkable. SEC EDGAR does not. The filing is free, public, machine-readable, timestamped, and legally the record.
For a reader who wants the primary document rather than a summary of it, EDGAR is the more reliable route to any US-listed company’s results, and it is where this article’s figures were taken from.
What the release contains beyond the headline
A release of this kind runs to many pages. Coverage tends to quote total revenue and earnings per share, but the release also carries the cloud revenue split, the RPO figure with its accompanying commentary, the segment detail, the cash-flow statement and the forward guidance.
For this company in particular, the material that has drawn most attention has often not been the headline revenue line, which is part of why reading the release rather than the coverage matters here.
What is an expected move, and what is IV crush?
Ahead of a scheduled report, the options market prices a range rather than a direction.
Options expiring shortly after the report imply a magnitude of movement market participants are collectively positioned for. That implied figure is a range, not a forecast of direction.
After the report the uncertainty resolves, and implied volatility in those contracts typically falls, a decline commonly described as IV crush. It is a mechanical consequence of a scheduled unknown becoming known, and it occurs whether the reported numbers were higher or lower than any estimate.
Our article on how earnings move stocks covers expected moves, IV crush and overnight gaps in full. Where a report lands outside the regular session, the same gapping mechanic described in our article on pre-market movers applies: with no continuous session running, the next traded price need not sit adjacent to the previous close. That affects the cost and certainty of execution rather than the direction of any instrument, and the effect is amplified in a margin account, where leverage increases both gains and losses relative to the capital committed.
Why does a beat not guarantee a higher share price?
Because the reported quarter is one component of a release, and because positioning going in already reflects an expectation.
Guidance can matter more than the quarter. A result above an estimate alongside an outlook below expectations is a common combination.
The benchmark is contested. Company guidance and provider consensus point to different thresholds, so “beat” is not a single well-defined event.
A backlog figure can dominate the reaction. For this company in particular, commentary on RPO and on cloud infrastructure capacity has drawn more attention than the quarter’s revenue line, and those are disclosures rather than the headline.
What was already priced in. If participants were positioned for a result comfortably above consensus, a result modestly above it is not the same event.
None of this predicts how any report will be received. It explains why the relationship between a reported number and a share price is not mechanical.
How does the market commonly read a report of this kind?
By separating what the company published from what is inferred from it.
The published components a reader can check directly are total revenue, the cloud revenue split, earnings per share on both bases, the RPO figure together with the commentary attached to it, and the guidance for the year. Each is a number the company published and stood behind, available in the filing before any commentary appears.
Everything after that is interpretation. Which benchmark a commentator uses, how much weight they give the backlog against the revenue line, and what they infer about the wider AI build-out are choices, and different commentators make them differently.
On read-through to other companies
Results from companies in a related supply chain are sometimes described as carrying a read-through to one another. That deserves care. These companies serve different customers, sell different products at different points in a supply chain, and report on different fiscal calendars. One company’s result is information about that company. Whether it tells a reader anything about another is a judgement, not a fact, and it is not a judgement this article makes.
Risks and limitations
No date here is confirmed. Every row in Table 1 is a provider projection, including the September date this article leads with. Confirm against Oracle’s investor-relations site, and treat any company announcement as superseding this article entirely.
The quarter had not closed when this was written. Oracle’s first fiscal quarter of 2027 ends August 31, 2026, so at the time of writing no part of the period being reported had finished being measured. Any figure circulating about it before then is an estimate by construction.
Estimates move continuously. Consensus figures are revised as analysts update submissions, most actively in the days before a report. The figures in Table 1 are stamped to their retrieval date and the estimates for quarters several months out will change many times before those quarters arrive.
One row of the surprise table is questionable. As flagged above, the Q2 FY2026 figure should be checked against the company’s own release before being relied upon.
RPO is a backlog, not a forecast. The company’s own commentary on how the increase arose is part of the disclosure and should be read with the number.
Provider figures are not interchangeable. This article names one provider. Another may publish different numbers.
Guidance can be revised. Figures in Table 4 were published in June 2026 and can change at any subsequent release. Guidance is a statement of expectation at a point in time, not a commitment, and companies routinely update it.
Trading involves risk of loss. Volatility around a scheduled report can widen spreads and produce gaps between sessions. The effect is amplified in a margin account, where leverage increases both gains and losses relative to the capital committed. Margin requirements and account minimums are set out in the relevant account documentation.
Nothing here is investment advice. This article reports scheduled dates, published company figures and historical data. It makes no recommendation about any security, states no price target, and expresses no view on whether any result will be higher or lower than any estimate.
A note on comparisons with other companies
Coverage of a cloud or AI-infrastructure result frequently compares one company against another, and a reader searching around this topic will encounter such comparisons constantly. This article does not make them.
The reason is partly factual. Companies described as peers often sell different products, to different customers, at different points in a supply chain, and report on different fiscal calendars. Oracle’s May year-end alone means its quarters do not line up with most of the companies it is set beside. A comparison that ignores that compares labels rather than businesses.
The other reason is that a comparison of that kind is an opinion presented as analysis. Stating that one company’s results are better than another’s, or that one is preferable to another, is a judgement about relative merit. This article confines itself to what the company has published about itself, with the source named, and leaves the judgement to the reader.
What is knowable before the report
The date once announced, the fiscal period it covers, the company’s own guidance, the previous quarter’s reported figures, and the consensus published by a named provider. All of those are facts, available free, from the company’s filings or from a provider that discloses its method.
What is not knowable is the result. Estimates circulate ahead of every report, they are opinions held by whoever produced them, and this article carries none.
Frequently asked questions
When does Oracle report earnings?
Oracle had not announced a first-quarter fiscal 2027 date as of August 19, 2026. A data provider projects September 14, 2026, which is an inference from past reporting patterns rather than a company statement. Confirm the date at Oracle’s investor-relations site.
Why is Oracle’s first quarter in August?
Because its fiscal year ends May 31 rather than December 31. The first fiscal quarter therefore runs from June through August, and the fourth quarter, which closes the fiscal year, runs from March through May and is reported in June.
What is RPO at Oracle?
Remaining performance obligations is contracted revenue that has not yet been recognised. Oracle reported $638 billion at the end of its fourth quarter of fiscal 2026, up 363 percent year over year and up $85 billion sequentially from the prior quarter’s figure of $553 billion.
Does RPO measure cloud demand?
Not straightforwardly. Oracle itself stated that most of the recent increase came from large-scale AI contracts where the customer prepaid for GPUs, or supplied the GPUs to Oracle. Those are genuinely contracted revenue but differ economically from ordinary consumption-based cloud contracts.
What has Oracle guided to for fiscal 2027?
At its fourth-quarter fiscal 2026 results Oracle confirmed prior guidance of $90 billion total revenue, expected revenue growth of 27 to 29 percent, and raised non-GAAP earnings-per-share guidance to $8.05. It also said it expects to raise approximately $40 billion in financing.
What were Oracle’s fiscal 2026 results?
Total revenues were $67.4 billion, up 17 percent in US dollars, with cloud revenues of $34.0 billion, up 39 percent, and GAAP earnings per share of $5.83, up 34 percent. Fourth-quarter total revenues were $19.2 billion, up 21 percent, with cloud revenues of $9.9 billion.
Sources
[^1]: Finnhub, endpoints /calendar/earnings and /stock/earnings for symbol ORCL, retrieved August 19, 2026. Source for the projected dates and consensus figures in Table 1 and the four-quarter surprise history in Table 5. These endpoints require an API key and are not publicly reproducible from a bare link; the domain without a key returns an authentication error. API documentation: finnhub.io/docs/api. Raw responses retained.
[^2]: Oracle Corporation, Annual Report on Form 10-K for the fiscal year ended May 31, 2026, filed with the US Securities and Exchange Commission on June 22, 2026 (CIK 0001341439), available on SEC EDGAR. Source for the fiscal year end and therefore for the quarter mapping in Table 2.
[^3]: Oracle Corporation, Form 8-K exhibit 99.1, fourth quarter and fiscal year 2026 results, filed with the US Securities and Exchange Commission on June 10, 2026 (CIK 0001341439), available on SEC EDGAR. Source for fourth-quarter total revenues of $19.2 billion and cloud revenues of $9.9 billion; full-year total revenues of $67.4 billion, cloud revenues of $34.0 billion and GAAP earnings per share of $5.83; fourth-quarter GAAP earnings per share of $1.45; remaining performance obligations of $638 billion, up 363 percent year over year and up $85 billion sequentially from $553 billion; the quoted commentary on the composition of the RPO increase; and the fiscal 2027 guidance of $90 billion total revenue, 27 to 29 percent revenue growth, non-GAAP earnings per share of $8.05, and approximately $40 billion of expected financing including a previously announced $20 billion at-the-market equity issuance. Oracle’s investor-relations site returns an access error to automated requests, so the filing was used directly; it is the primary record in any case.
This article is published by Capital Markets Elite Group (KY) Limited for informational and educational purposes only. It does not constitute investment advice, a recommendation, or an offer or solicitation to buy or sell any security or financial instrument. Trading involves risk, including the risk of loss. Past performance and historical data are not indicative of future results. Figures are stated as of the dates shown and may change. Readers should consider their own circumstances and consult a qualified professional where appropriate. See our full terms at /policies/.