


Short interest is the number of shares that have been sold short but not yet covered. FINRA collects it from firms twice a month and publishes consolidated data on a set schedule, so the “most-shorted stocks” list refreshes every two weeks. This hub explains what the data is, when it comes out, how to read days-to-cover and short float, and how short squeezes have worked historically. The names shown are data, not a watchlist or a recommendation, and squeezes cut both ways. Most day traders lose money.
Data on this page is refreshed after each FINRA short-interest publication. The schedule below is current as of July 10, 2026; the named-data table is updated on each publication date.
What is short interest, and where does the data come from?
Short interest is the total number of shares of a stock that have been sold short and not yet bought back to close the position. It is usually expressed two ways: as a raw share count, and as short interest as a percentage of float (the shares available to trade). A higher percentage means a larger share of the tradable stock is held short.
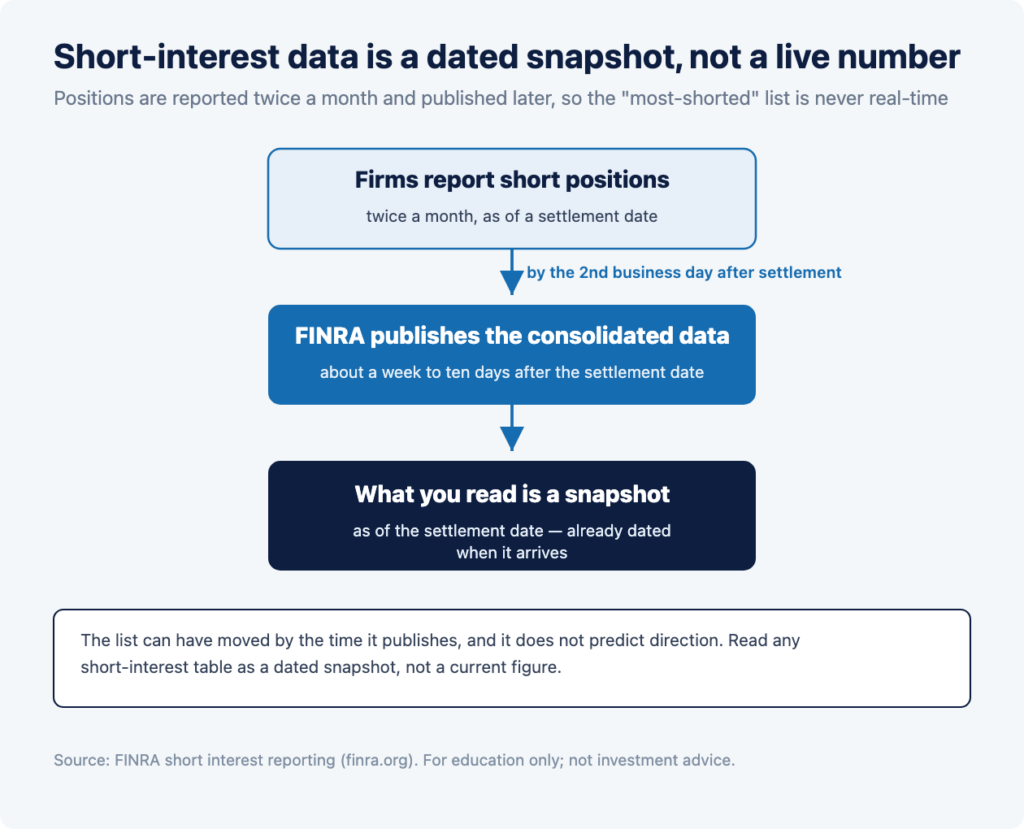
The data is not real-time. Per FINRA, firms must report their short positions twice a month, and FINRA then publishes the consolidated figures on a set schedule. So the published “most-shorted” list is a snapshot as of a settlement date, disseminated about a week to ten days later — not a live number.
| Settlement date (positions as of) | Publication date |
| July 15, 2026 | July 24, 2026 |
| July 31, 2026 | August 11, 2026 |
| August 14, 2026 | August 25, 2026 |
| August 31, 2026 | September 10, 2026 |
Because the data is a dated snapshot, the list can look different from one cycle to the next, and the published figure can already be stale by the time it comes out. That lag is itself something to understand before reading any short-interest table as current.
This cycle’s short-interest data
The table below lists the highest short-interest names for the most recent published cycle, as data — the short interest, the short interest as a percentage of float, and days to cover for each. It is drawn from the FINRA/exchange short-interest file for the cycle shown. It is not a watchlist, a set of ideas, or a recommendation of any kind; it is a factual snapshot of where reported short interest was highest as of the settlement date, sorted by that measure.
| Company (ticker) | Short interest (% of float) | Short interest (shares) | Days to cover |
| e.g. Example Co (XYZ) — illustrative only | e.g. 25% | e.g. 40,000,000 | e.g. 4.5 |
A note on how this table is handled, for compliance: it can run either named (with the tickers, as above, clearly framed as dated data and not a watchlist — the same framing used for the premarket-movers data) or anonymized (showing the distribution — for example, how many names sit above 20% of float, and the range of days-to-cover — without listing tickers). The anonymized version conveys the same market picture without publishing a name list. Compliance chooses which version ships.
Days to cover and short float: how to read the numbers
Two derived figures do most of the work when reading short-interest data:
- Short interest as a percentage of float — the shares held short divided by the shares available to trade. It is a measure of how crowded the short side is relative to the tradable supply.
- Days to cover (the short-interest ratio) — the shares held short divided by the stock’s average daily trading volume. It estimates, roughly, how many days of normal trading it would take for shorts to buy back their positions. A higher days-to-cover means it would take longer, all else equal.
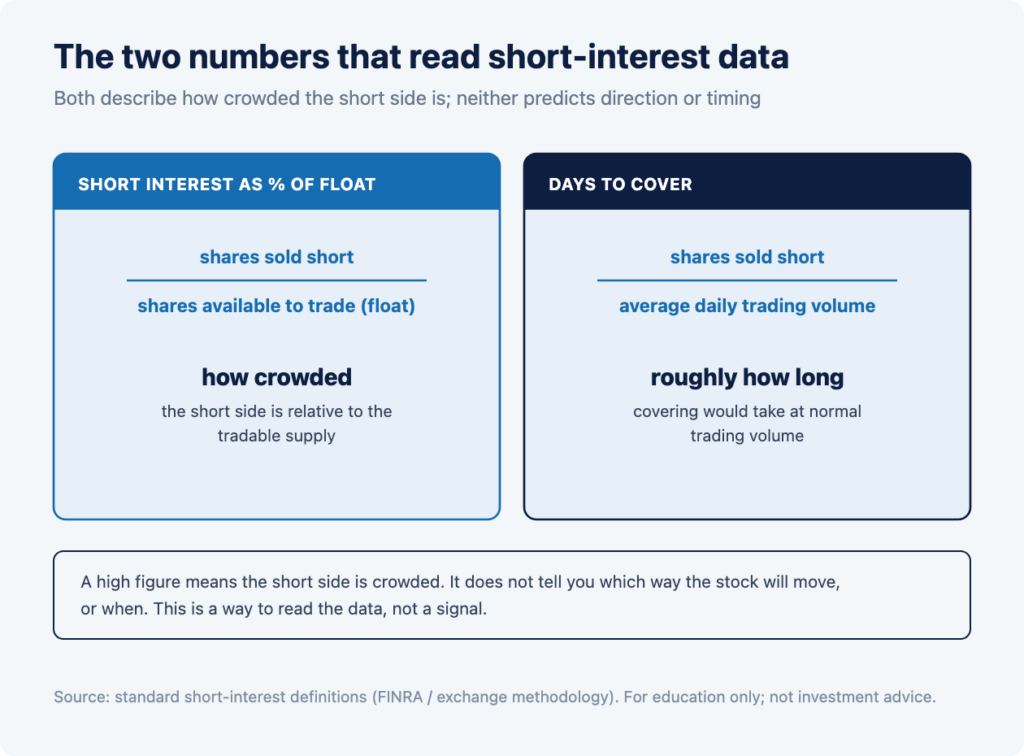
Neither figure predicts anything. A high short-interest percentage or a high days-to-cover tells you the short side is crowded; it does not tell you which way the stock will move, or when. Our short-selling education guide walks through these definitions in more detail.
How the data changes from cycle to cycle
Because short interest is a snapshot taken twice a month, comparing one cycle to the next shows the direction of positioning: whether short interest in a name rose or fell between settlement dates. Traders watch the change, not just the level — a name where short interest is building looks different from one where shorts are covering.
Two cautions travel with any cycle-to-cycle read. First, the data is dated on arrival, so the picture may have moved by the time it publishes. Second, a change in short interest has more than one explanation — new short positions, covering, hedging tied to other instruments — and the raw number does not distinguish among them.
Short squeezes in history: the mechanics
A short squeeze is a mechanic worth understanding factually. When a heavily shorted stock rises, some short sellers may buy shares to close their positions and limit losses; that buying can push the price higher, which can prompt more covering — a feedback loop. High short interest and a high days-to-cover are the conditions people point to when discussing squeeze potential, because they describe a crowded short side that could take time to unwind.
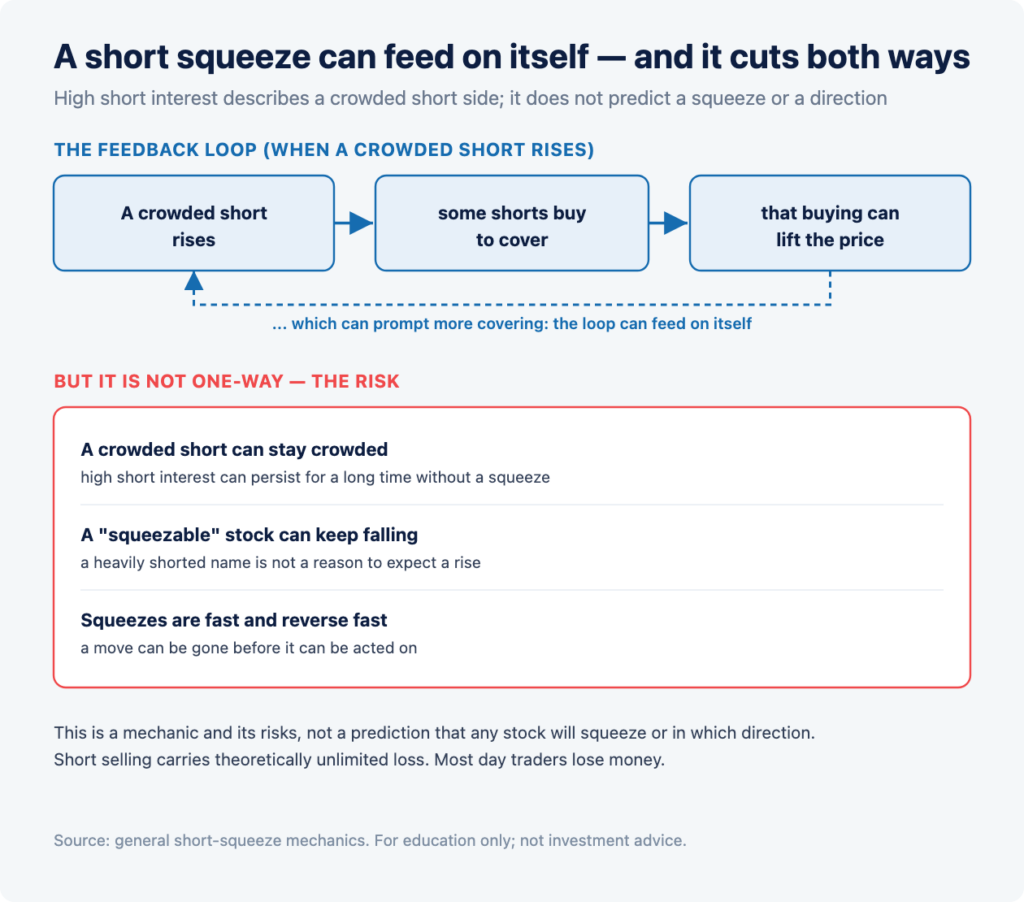
But the loop is not a one-way outcome, and this is the part that matters for risk. A crowded short can stay crowded; a stock that looks “squeezable” can keep falling; and squeezes, when they happen, are fast and reverse just as fast. History offers episodes in both directions. Our article on short squeezes covers the mechanics and several cases. Nothing here suggests a squeeze will or will not happen in any name.
What traders watch
Factually, the items market participants tend to focus on with short-interest data:
1. Short interest as a percentage of float — how crowded the short side is relative to tradable supply.
2. Days to cover — roughly how long covering would take at normal volume.
3. The change since the last cycle — whether short interest is building or being covered.
4. The publication lag — the data is a dated snapshot, not a live figure.
5. Volume and volatility — how liquid the name is, which shapes how any covering would actually play out.
Watching the data is not the same as trading on it. These are the figures in the report, not a suggestion to take any position, long or short.
Risks
Trading around short-interest data involves substantial risk, and it cuts both ways. A heavily shorted stock can keep falling, so “high short interest” is not a reason to expect a rise. A squeeze, if it occurs, is fast and can reverse just as quickly, so a move can be gone before it can be acted on. Short selling itself carries theoretically unlimited loss, because a stock can keep rising, and it involves borrowing stock, margin, and buy-in risk.
The published data is a dated snapshot, not a live number, and it does not predict direction. Prices can move sharply either way, liquidity can be thin, and most day traders lose money. Nothing on this page is a recommendation to buy, sell, or short any security.
FAQ
What are the most shorted stocks right now?
The “most-shorted stocks” are the names with the highest reported short interest in the latest FINRA short-interest publication. Because FINRA publishes twice a month, the list refreshes every two weeks and is a dated snapshot as of a settlement date, not a live figure. This hub updates its data table on each publication date.
When is short-interest data published?
Twice a month. Firms report short positions as of a settlement date (mid-month and month-end), and FINRA publishes the consolidated data about a week to ten days later. For example, positions as of July 15, 2026 are scheduled to publish July 24, 2026 (per FINRA’s schedule).
What is days to cover?
Days to cover (the short-interest ratio) is the number of shares held short divided by the stock’s average daily volume. It roughly estimates how many days of normal trading it would take for short sellers to buy back their positions. It describes crowding; it does not predict direction.
Does high short interest mean a stock will go up?
No. High short interest means the short side is crowded; it does not mean the stock will rise. A heavily shorted stock can keep falling. Squeezes can happen, but they are not guaranteed, and they can reverse quickly. It is data, not a signal to buy.
Where does the short-interest data come from?
From FINRA, which requires firms to report short positions twice a month and publishes the consolidated figures; exchange-level data is also available. This hub sources its table from the FINRA/exchange short-interest file for the cycle shown.
Disclosures: Trading involves substantial risk and is not suitable for every investor. Short selling carries theoretically unlimited loss potential and involves borrowing, margin, and buy-in risk. Short-interest data is a dated snapshot, not a live figure, and does not predict direction. Capital is at risk and most day traders lose money. Leverage and margin, where offered, amplify both gains and losses, and you can lose more than you deposit. Client accounts are not SIPC or FSCS insured. This content is provided for information and education only. It is not investment advice or a recommendation of any security. Short-interest figures are sourced from FINRA/exchange data as of the dates shown. See our full disclosures and policies.
<!– CMS: NewsArticle schema — headline, datePublished, dateModified (update each cycle), publisher=CMEG, about=”Short interest / most-shorted stocks”. FAQPage schema on the FAQ block. Internal links to wire at publish: “short-selling education guide” → Short Selling guide; “short squeezes” → Short Squeezes article; disclosures → /policies/. –>
<!– PUBLISH-DAY REFRESH BOX (populate the data table before publishing):
1. On the publication date (next: ~July 24, 2026 for the July 15 settlement cycle), pull the FINRA/exchange short-interest file. Confirm the schedule table dates against finra.org.
2. POPULATE “This cycle’s short-interest data”: replace the illustrative row with the actual highest-short-interest names, sorted by short interest as a % of float. For each: short interest (% of float), short interest (shares), days to cover (short interest ÷ average daily volume). Keep the “data as of [settlement date], not a watchlist/recommendation” framing verbatim.
3. COMPLIANCE CHOICE: ship NAMED (tickers + the not-a-watchlist framing) OR ANONYMIZED (distribution — count of names above 20% of float, the days-to-cover range — no tickers). Preston/Fiona/Rachel decide; both are drafted for.
4. Update the caption cycle/publication dates and the “as of” stamp. Do NOT add any directional or squeeze prediction.
5. Recurring: repeat each FINRA cycle (biweekly).
–>