


Adobe has confirmed it will report third-quarter fiscal 2026 results on Thursday, September 10, 2026, with a conference call at 2:00 p.m. Pacific, which is 5:00 p.m. Eastern. The company guided to revenue of $6.67 billion to $6.72 billion for the quarter. Provider consensus sits above the top of that range. Reported figures and mechanics only, not a recommendation.
Data as of August 24, 2026. Figures are historical or previously published and are not a forecast.
When does Adobe report third-quarter results?
Thursday, September 10, 2026, with the call at 2:00 p.m. Pacific Time.
The date is confirmed by the company. Adobe’s investor-relations page lists a “Q3 FY2026 earnings call” for Thursday, September 10, 2026 at 2:00 p.m. Pacific Time.[^1] That converts to 5:00 p.m. Eastern.
| Fiscal quarter | Date | Session | Consensus EPS | Consensus revenue | Date status |
| Q3 FY2026 | September 10, 2026 | After the close | $6.20 | Approximately $6.82bn | Company-confirmed |
| Q4 FY2026 | December 8, 2026 | After the close | $6.43 | Approximately $6.96bn | Provider projection |
| Q1 FY2027 | March 10, 2027 | Not stated | $6.88 | Approximately $7.12bn | Provider projection |
| Q2 FY2027 | June 9, 2027 | Not stated | $6.93 | Approximately $7.34bn | Provider projection |
A confirmed date is not the norm across this month’s reporters
It is worth noting that this is settled, because several September reporters had not set their dates at the time of writing. A confirmed date carries the company’s own authority. A projected date is a provider’s inference from past reporting patterns, and it is superseded the moment the company announces.
Adobe’s is the former. It should still be re-checked before being relied upon, since a company can revise a date it has announced.
Why is a September report a “third quarter”?
Because Adobe’s fiscal year ends late in the calendar year rather than in December.
Its third fiscal quarter of 2026 therefore covers the summer months, and the results published in September describe a period that ended shortly beforehand. The fiscal label follows the company’s own accounting calendar, not the calendar year.
The practical consequence is the familiar one: comparing Adobe against a calendar-year company compares different windows of time.
What did Adobe guide to for this quarter?
Specific ranges, published by the company itself alongside its previous results.[^2]
| Measure | Guided range |
| Total revenue | $6.67 billion to $6.72 billion |
| Creative & Marketing Professionals subscription revenue | $4.61 billion to $4.64 billion |
| Business Professionals & Consumers subscription revenue | $1.87 billion to $1.89 billion |
| GAAP earnings per share | $4.40 to $4.45 |
| Non-GAAP earnings per share | $6.05 to $6.10 |
Two features of that table are worth pausing on.
The company guides to ranges, not points. A result anywhere inside a range is a result the company told the market to expect.
GAAP and non-GAAP differ by roughly $1.65 per share. Both are published. GAAP follows the standard accounting framework; non-GAAP adjusts for items the company identifies and discloses, and those adjustments are defined by the company rather than by an external standard. Neither is more correct; they measure different things, and a headline comparing one to an estimate built on the other is comparing different quantities.
Where does provider consensus sit against that guidance?
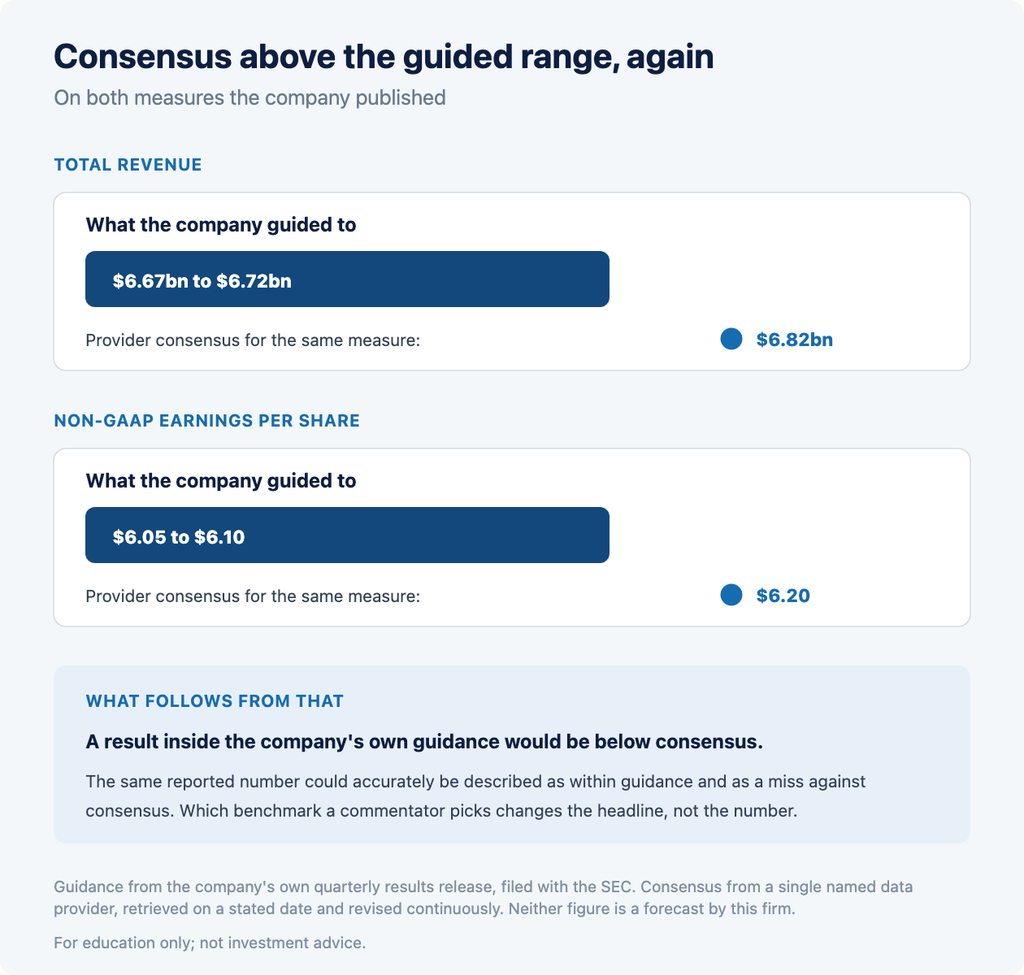
Above the top of the guided range, on both measures.
| Measure | Company guided range | Provider consensus | Where consensus sits |
| Total revenue | $6.67bn to $6.72bn | Approximately $6.82bn | Above the top of the range |
| Non-GAAP earnings per share | $6.05 to $6.10 | Approximately $6.20 | Above the top of the range |
The practical consequence is worth stating plainly: a result landing anywhere inside the company’s own guidance would be below that provider’s consensus. Coverage of such a result could accurately describe it as within guidance and as a miss against consensus, in the same sentence.
Neither figure is wrong. Guidance is what management chose to publish at a point in time and does not move between releases. Consensus is an average of outside estimates that keeps moving, and analysts routinely model above or below a company’s stated outlook.
Which benchmark a commentator picks changes the headline without changing the number. Establishing which one is in use is the first thing to do when reading any account of a results release.
How precisely is Adobe modelled?
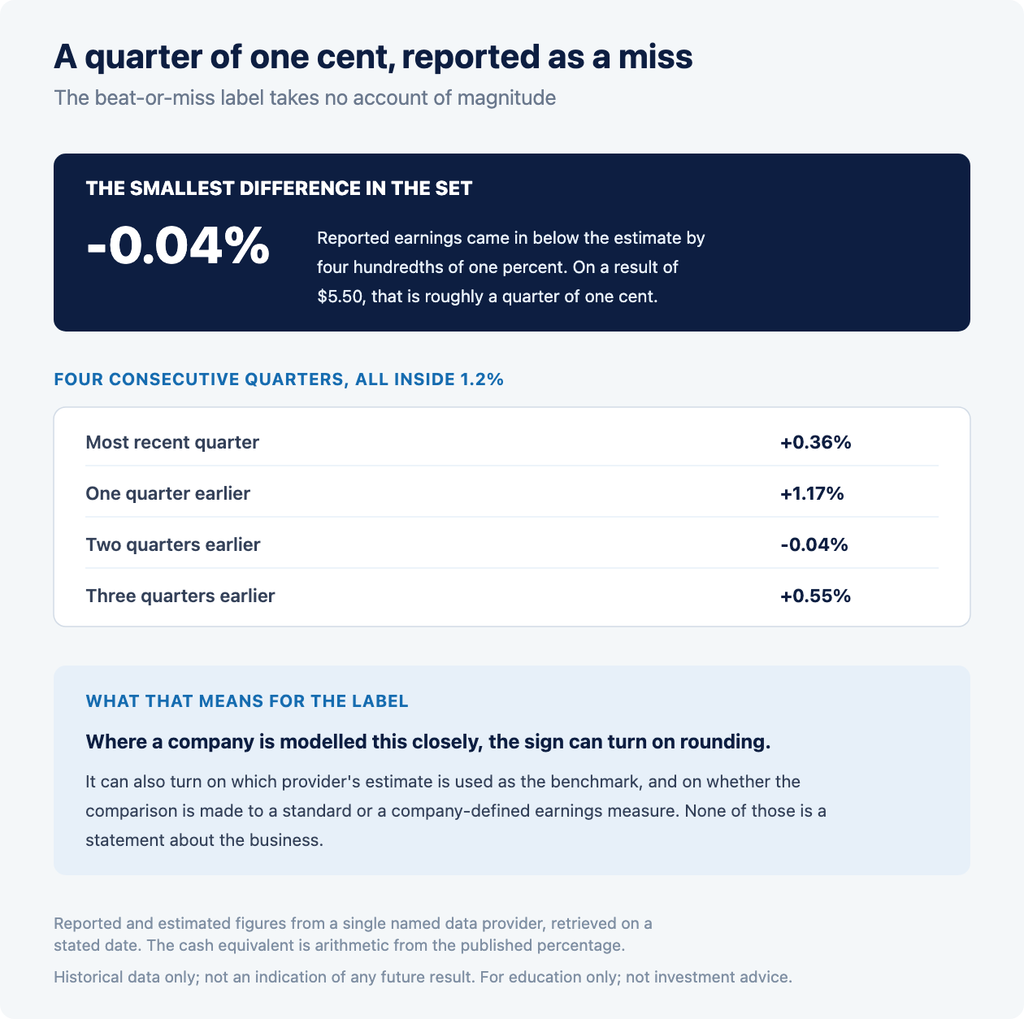
More precisely than any other company in this month’s reporting cohort, and that fact changes how the word “miss” should be read.
| Fiscal quarter | Period ending | Reported | Estimate | Difference |
| Q2 FY2026 | June 30, 2026 | $5.96 | $5.94 | +0.36% |
| Q1 FY2026 | March 31, 2026 | $6.06 | $5.99 | +1.17% |
| Q4 FY2025 | December 31, 2025 | $5.50 | $5.50 | -0.04% |
| Q3 FY2025 | September 30, 2025 | $5.31 | $5.28 | +0.55% |
Every one of the four landed within 1.2 percent of the estimate. Three were above, one below.
What a 0.04 percent “miss” actually is
The fourth-quarter fiscal 2025 figure came in 0.04 percent below the estimate. On a reported $5.50, that is a difference of roughly a quarter of one cent.
A difference of that size would still be reported as a miss, because the beat-or-miss label is binary and takes no account of magnitude. That is the clearest illustration in this batch of why the label carries less information than it appears to.
Where a company is modelled this closely, the sign of the difference can turn on rounding, on which provider’s estimate is used as the benchmark, and on whether the comparison is to GAAP or non-GAAP. None of those is a statement about the business.
For contrast
Other companies reporting in the same window have produced far larger differences. That is not a judgement about any of them; it reflects how difficult each business is to model from outside. A subscription business with substantial recurring revenue is inherently more predictable quarter to quarter than one exposed to commodity pricing, because a large share of the coming quarter’s revenue is already contracted before the quarter begins.
The lesson runs the other way too: a small beat at a closely modelled company is a weaker signal than a small beat at a volatile one, because the estimate was always likely to land close.
Why recurring revenue narrows the range
Where revenue arrives largely from subscriptions already in force, the variable portion of a quarter is smaller. Analysts modelling such a business are estimating the increment rather than the whole, which is a narrower problem and produces a tighter distribution of estimates around the outcome.
This is a structural property of the revenue model rather than a statement about management or forecasting skill. It also means the disclosures that describe the recurring base, ARR and the backlog measures discussed below, carry more information about the coming period than they would at a company with a different revenue profile.
What is ARR, and what does Adobe’s figure include?
Annualised recurring revenue, a measure of the run-rate value of subscriptions.
Adobe reported total ARR exiting its second quarter of $27.10 billion, and disclosed in the same sentence that this included “approximately $480 million from Semrush.”[^2]
That disclosure matters for a specific reason. Total ARR and organic ARR are different quantities, and where a company has made an acquisition the total includes contribution that did not come from growth in the existing business. Adobe states the acquired contribution, which allows a reader to separate the two. Not every company does.
ARR is also not revenue. It is a run-rate measure of subscriptions in force at a point in time, annualised as though those subscriptions ran unchanged for twelve months. Revenue is what was actually recognised in the period. The two answer different questions and will not match.
What are remaining performance obligations, and what is cRPO?
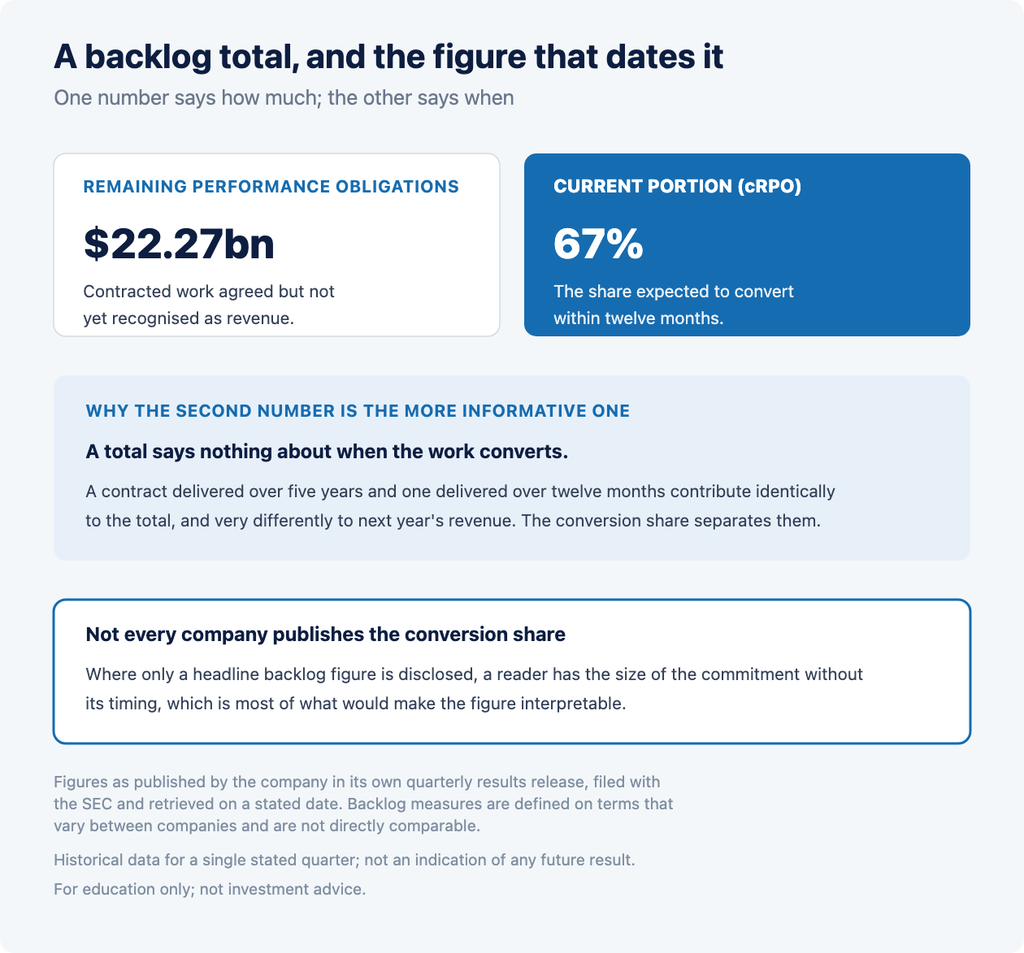
RPO is the value of contracted work a company has agreed to deliver but has not yet recognised as revenue. Adobe reported $22.27 billion exiting the quarter.[^2]
More useful, and less commonly disclosed, is the second figure Adobe published alongside it: current remaining performance obligations, or cRPO, at 67 percent.[^2]
Why the second number is the more informative one
A headline backlog figure says nothing about when the work converts to revenue. A contract delivered over five years and one delivered over twelve months contribute identically to RPO and very differently to next year’s revenue.
The cRPO proportion answers that. At 67 percent, roughly two-thirds of the backlog is expected to convert within twelve months, and a third beyond it.
That single percentage does more to make the backlog figure interpretable than the backlog figure does on its own, and a reader encountering an RPO number without a conversion proportion is working with considerably less information.
What did the last reported quarter show?
Adobe reported second-quarter fiscal 2026 revenue of $6.62 billion, describing it as “13% year-over-year growth, or 11% in constant currency.”[^2]
Two observations belong with that.
Constant currency is reported alongside. The two-percentage-point gap between the reported and constant-currency growth rates is exchange-rate movement rather than business performance. Where a company reports both, the constant-currency figure isolates the underlying change.
The company describes the figure as “record.” That is Adobe’s own characterisation of its own results, quoted here and attributed. It is not adopted as this firm’s view, and superlatives in any company release should be read as the issuer’s framing rather than as neutral description.
What is published on results day, and in what order?
The same sequence each quarter, and it starts before any commentary exists.
A filing. Adobe furnishes its results to the US Securities and Exchange Commission on Form 8-K, with the release attached as exhibit 99.1. That exhibit carries the revenue figures, the subscription lines, the ARR and backlog disclosures and the guidance, and it is public on SEC EDGAR the moment it is filed. Every company figure in this article was read from exactly such an exhibit.[^2]
The release, published simultaneously on the company’s own investor-relations pages, carrying the same content.
The conference call, at 2:00 p.m. Pacific.[^1] Management discusses the quarter and, in the ordinary course, addresses the outlook.
Why the order matters
The numbers are public before the call begins and before any coverage appears. A reader who waits for a summary is reading someone else’s account of a document already available to them, free and in full.
For this company the filing repays reading directly, because the disclosures that make the headline interpretable, such as the acquired contribution inside ARR and the cRPO conversion proportion, sit inside the release rather than in most summaries of it.
Finding the filing yourself
EDGAR indexes filings by company. Adobe’s sit under CIK 796343, and results announcements are the 8-K filings carrying the results exhibit. That is a free, authoritative route to the primary document that does not depend on any provider.
What is an expected move, and what is IV crush?
Ahead of a scheduled report, the options market prices a range rather than a direction.
Options expiring shortly after the report imply a magnitude of movement participants are collectively positioned for. That implied figure is a range, not a forecast of direction.
After the report the uncertainty resolves and implied volatility in those contracts typically falls, a decline commonly described as IV crush. It happens whether the reported numbers were higher or lower than any estimate.
Why an after-the-close report gaps
Adobe reports after the close, so the information arrives while the regular session is shut and orders cannot meet at a continuous sequence of prices in the interval. When trading resumes, the opening price reflects information that arrived overnight and need not sit adjacent to the previous close.
Our articles on how earnings move stocks and on pre-market movers cover both mechanics in full. The consequences concern execution cost and certainty rather than direction: a market order entered into the first minutes after such an open executes against whatever liquidity is present then, and a stop order carries the same exposure once triggered.
Why does a beat not guarantee a higher share price?
Because a release contains more than the quarter, and because positioning going in already reflects an expectation.
Guidance can matter more than the quarter. A result above an estimate alongside an outlook below expectations is a common combination, and Adobe publishes guidance with every release.
The benchmark is contested. As Table 3 shows, guidance and consensus point to different thresholds for the same quarter.
The margin can be immaterial. As Table 4 shows, differences at this company have recently been fractions of a percent. A beat of that size is not the same event as a large one, and coverage reporting both as “a beat” discards the distinction.
What was already priced in. If participants were positioned for a result comfortably above consensus, a result modestly above it is not the same event.
None of this predicts how any report will be received. It explains why the relationship between a reported number and a share price is not mechanical.
What do the two subscription lines measure?
Adobe guides and reports two subscription revenue lines separately, and they are not the same size or the same business.
| Line | Guided range | Share of guided total revenue |
| Creative & Marketing Professionals subscription revenue | $4.61bn to $4.64bn | Roughly two-thirds |
| Business Professionals & Consumers subscription revenue | $1.87bn to $1.89bn | Roughly a quarter |
The two guided ranges together do not sum to the guided total, because total revenue includes items outside these two subscription lines. That is a property of how the company reports, not a discrepancy.
Why the split is worth reading
A single total-revenue figure is an aggregate over lines that can move at different rates. Where a company guides to each separately, as here, a reader can see which line the total depends on and whether a change in the total came from the larger or the smaller one.
Two quarters with identical headline revenue can therefore describe different underlying situations, and the company publishes the components precisely so that the distinction is visible.
A note on segment naming
These line names describe customer groups rather than products. Reporting structures are set by the company and can be revised, and when they are, prior-period figures are typically restated onto the new basis.
The practical consequence for anyone comparing across several years is to check whether the lines being compared were defined the same way in both periods. A figure quoted from an older release may sit under a heading the company no longer uses.
How does the market commonly read an Adobe release?
By separating the published disclosures from the interpretation placed on them.
The checkable components are total revenue and its constant-currency equivalent, the two subscription revenue lines, the ARR figure and its disclosed acquired contribution, RPO and cRPO, and the guidance for the following quarter. Each is a number the company published and stood behind, available in the filing before any commentary appears.
Everything after that is interpretation. How much weight to place on ARR against revenue, what the cRPO proportion implies, and what any of it says about the wider software industry are judgements, and different commentators make them differently.
On the questions this article does not answer
Search interest around this company includes a large volume of directional commentary in both directions, asking whether the shares are overvalued or why they have moved. This article answers neither.
Those questions require causal claims about a share price that cannot be sourced to any disclosure, and answering them would mean substituting opinion for the published record. This article states no price target, makes no prediction, and expresses no view on whether any result will be higher or lower than any estimate.
Risks and limitations
The date is confirmed but revisable. A company can move a date it has announced, and confirmation is a commitment rather than a guarantee. Re-check against the investor-relations page before relying on it, particularly if any time has passed since this article was published.
Later dates in Table 1 are projections. Only the September row is a company statement.
Estimates move. Consensus is revised continuously and most actively before a report. The figures here are stamped to their retrieval date.
Provider figures are not interchangeable. This article names one provider. Another may publish different numbers, and comparing across providers is not like-for-like.
Non-GAAP measures are company-defined. The adjustments are disclosed by the company and are not set by an external standard, so a non-GAAP figure at one company is not directly comparable to one at another.
ARR includes acquired contribution. The company discloses approximately $480 million from an acquisition within the total, so total ARR is not organic ARR, and a year-over-year comparison of the total will reflect both growth and the acquisition unless the two are separated.
Historical results describe the past only. Table 4 records four quarters and carries no information about any future one. A tight historical record does not make the next result predictable; it describes how closely estimates have tracked outcomes in periods that are now closed, which is a statement about the estimating process rather than a property of the business that must persist.
Trading involves risk of loss. Volatility around a scheduled report can widen spreads and produce gaps between sessions. The effect is amplified in a margin account, where leverage increases both gains and losses relative to the capital committed. Margin requirements and account minimums are set out in the relevant account documentation.
Nothing here is investment advice. This article reports a scheduled date, published company disclosures and historical data. It makes no recommendation about any security.
A note on comparisons with other companies
Coverage of a software result frequently sets one company against another, and a reader searching around this topic will meet such comparisons often. This article does not make them.
Partly that is factual. Companies described as peers define their segments differently, report on different fiscal calendars, and disclose different measures. ARR and backlog in particular are contracted and defined on terms that vary, so two similar-sounding figures are frequently not measuring the same thing.
The other reason is that a comparison of that kind is an opinion presented as analysis. Saying one company’s results are better than another’s is a judgement about relative merit. This article confines itself to what the company has published about itself, with the source named, and leaves the judgement to the reader.
Frequently asked questions
When does Adobe report earnings?
Adobe has confirmed a Q3 FY2026 earnings call for Thursday, September 10, 2026 at 2:00 p.m. Pacific Time, which is 5:00 p.m. Eastern, on its own investor-relations page. Later dates circulating for subsequent quarters are data-provider projections rather than company statements.
What has Adobe guided to for the third quarter?
In its previous results release Adobe guided to total revenue of $6.67 billion to $6.72 billion, GAAP earnings per share of $4.40 to $4.45, and non-GAAP earnings per share of $6.05 to $6.10, alongside separate guided ranges for each of its two subscription revenue lines.
Is the consensus estimate above or below Adobe’s guidance?
Above. Provider consensus of roughly $6.82 billion in revenue and $6.20 per share both sit above the top of the ranges Adobe guided to, meaning a result inside the company’s own guidance would be below that provider’s consensus on both measures.
What is cRPO and why does Adobe report it?
Current remaining performance obligations expresses the proportion of contracted backlog expected to convert to revenue within twelve months, and Adobe reported it at 67 percent. It makes a backlog figure interpretable, because a headline total says nothing at all about when the work converts.
Does Adobe’s ARR figure include acquisitions?
Yes, and the company discloses the amount. Total ARR exiting the second quarter was $27.10 billion, which Adobe stated included approximately $480 million from Semrush. Total ARR and organic ARR are therefore different quantities, and only the disclosure allows a reader to separate them.
Has Adobe been beating estimates?
Across the four most recent quarters the reported figure landed within 1.2 percent of the estimate every time, three above it and one below. One difference was just 0.04 percent, which is roughly a quarter of one cent on a reported $5.50.
Sources
[^1]: Adobe Inc., investor-relations page, adobe.com/investor-relations.html, upcoming events section listing “Q3 FY2026 earnings call, Thursday, September 10, 2026, 2:00pm Pacific Time.” Retrieved August 24, 2026. Source for the confirmed date and the call time.
[^2]: Adobe Inc., Current Report on Form 8-K, exhibit 99.1, second quarter fiscal 2026 financial results, filed with the US Securities and Exchange Commission under CIK 796343, accession number 0000796343-26-000109, document adbeex991q226.htm, available on SEC EDGAR. Retrieved August 24, 2026. Source for second-quarter revenue of $6.62 billion and the stated 13 percent year-over-year growth and 11 percent in constant currency; total ARR of $27.10 billion including approximately $480 million from Semrush; remaining performance obligations of $22.27 billion and current remaining performance obligations of 67 percent; the third-quarter guidance ranges for total revenue, both subscription revenue lines, and GAAP and non-GAAP earnings per share; and the company’s own use of the word “record”.
[^3]: Finnhub, endpoints /calendar/earnings and /stock/earnings for symbol ADBE, retrieved August 24, 2026. Source for the projected dates and consensus figures in Table 1, the consensus comparison in Table 3, and the four-quarter reported-versus-estimate history in Table 4. These endpoints require an API key and are not publicly reproducible from a bare link; the domain without a key returns an authentication error. API documentation: finnhub.io/docs/api. Raw responses retained.
This article is published by Capital Markets Elite Group (KY) Limited for informational and educational purposes only. It does not constitute investment advice, a recommendation, or an offer or solicitation to buy or sell any security or financial instrument. Trading involves risk, including the risk of loss. Past performance and historical data are not indicative of future results. Figures are stated as of the dates shown and may change. Readers should consider their own circumstances and consult a qualified professional where appropriate. See our full terms at /policies/.