


Gold is the asset traders call a “safe haven,” meaning money tends to rotate toward it when uncertainty rises. But a geopolitical shock does not lift gold automatically. The same events that create safe-haven demand can also push up the dollar, bond yields, and rate expectations — and those are headwinds for gold. In early July 2026, that is exactly what happened: a safe-haven bid from U.S.-Iran tensions ran into a firmer dollar and higher real yields, and gold traded volatile rather than in a clean rally. This piece explains the mechanics of the flight-to-quality pattern and how the gold complex actually trades. It is factual and does not forecast gold or any security.
Data on this page is current as of July 10, 2026. Interest-rate and dollar figures are from FRED; the gold price level and the market narrative are attributed to dated market reporting. This is an evergreen mechanics explainer refreshed when the episode changes.
What is moving gold right now?
Through late June and early July 2026, gold traded in a volatile range and came off its earlier highs. Market reporting on July 9, 2026 put spot gold around $4,000 to $4,100 per ounce, after it had traded closer to $4,200 in mid-June, per coverage from outlets including Kitco and market-data services. The move was two-sided, not a straight-line rise.
The driver traders were watching was a familiar one: renewed U.S.-Iran tensions, the same geopolitical shock that pushed oil higher. Our oil-shock article covers that event and how it transmitted to energy stocks. On its own, that kind of uncertainty tends to create demand for assets the market treats as havens, gold chief among them.
But that safe-haven bid did not simply lift gold, and the reason is the more useful part of the story. As financial-media coverage in early July described it, a stronger U.S. dollar, higher bond yields, and a more hawkish set of Federal Reserve expectations offset the haven demand. One report framed gold as fighting a “two-front war” — geopolitics pulling one way, rate and dollar dynamics pulling the other. The result was a market that could not decide, rather than one that only went up.
That tension is the whole lesson of this article. A shock creates a reason to buy gold and, often at the same time, reasons not to. Which force wins on a given day is not something this article predicts; the point is to understand both.
What is a “safe-haven” trade?
“Safe haven” is the market’s term for an asset that investors tend to move money into when they want to reduce risk. A more precise name for the behavior is the flight-to-quality pattern: when uncertainty spikes, some participants sell assets they see as risky (often equities) and rotate into assets they see as more defensive (often gold, U.S. Treasuries, and sometimes the U.S. dollar or the Japanese yen).
It is important to be exact about what that label does and does not mean. Calling gold a “safe haven” is a description of a market behavior — a tendency for demand to rise in stress — not a statement that gold is safe or that it protects capital. Gold has no yield, no earnings, and no cash flows; its price can fall sharply, and it did come off its highs even during the July 2026 episode. The flight-to-quality pattern is a rotation traders observe, not a guarantee of anything.
Why gold, specifically
Gold’s role as a haven is partly historical and partly structural. It is not any single government’s liability, it is liquid and traded worldwide, and it has a long track record of being treated as a store of value during periods of financial or geopolitical stress. Those features are why the market reaches for it, not a promise that it will rise when stress appears.
The pattern is a tendency, not a rule
The flight-to-quality pattern describes what often happens, on average, across many episodes. It is not a mechanical rule that applies to every shock. As the July 2026 episode shows, the pattern can be overwhelmed by other forces — which is exactly why understanding those other forces matters.
Why does gold rise in a shock — and why did it not simply rise this time?
The direct answer to the popular question “why is gold going up” is that, in a shock, safe-haven demand can lift it. But that answer is incomplete, and the incomplete version is what gets traders into trouble. Gold’s price is a tug-of-war between the haven bid and a set of powerful cross-currents.
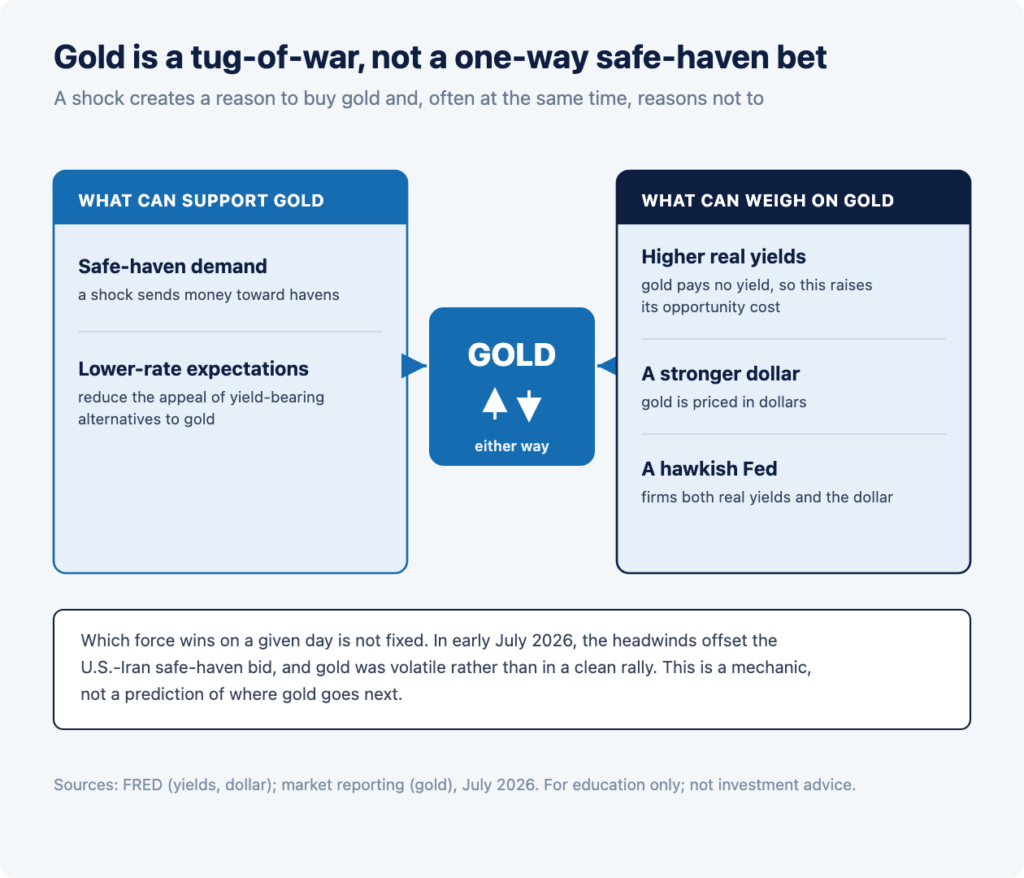
On the supportive side of the ledger, a geopolitical shock, a banking scare, or a sharp fall in equities can send money toward gold. Expectations of lower interest rates can help too, because lower rates reduce the appeal of yield-bearing alternatives to gold.
On the other side sit the headwinds, and in July 2026 they were the dominant force:
- Higher real yields. Gold pays no interest, so when inflation-adjusted (real) yields on Treasuries rise, the opportunity cost of holding a zero-yield asset rises with them. That is a classic gold headwind, and real yields rose during this episode.
- A stronger dollar. Gold is priced in dollars globally, so a firmer dollar tends to weigh on the gold price, all else equal.
- A more hawkish Fed. If the market prices fewer or later rate cuts, both real yields and the dollar tend to firm — a double headwind for gold.
In early July 2026, all three of those headwinds were present at once, which is why the safe-haven bid from U.S.-Iran tensions did not translate into a clean rally. Gold went up on the fear and down on the rates-and-dollar picture, and the net result was volatility. Understanding that gold sits inside this tug-of-war is far more useful than memorizing “shock equals gold up.”
Gold, the dollar and Treasuries: how the complex interacts
In calm markets, gold, the dollar, and Treasury yields usually relate to each other in predictable ways: a stronger dollar and higher yields tend to weigh on gold, and a weaker dollar and lower yields tend to support it. Those are tendencies, not laws, but they hold often enough to be a useful baseline.
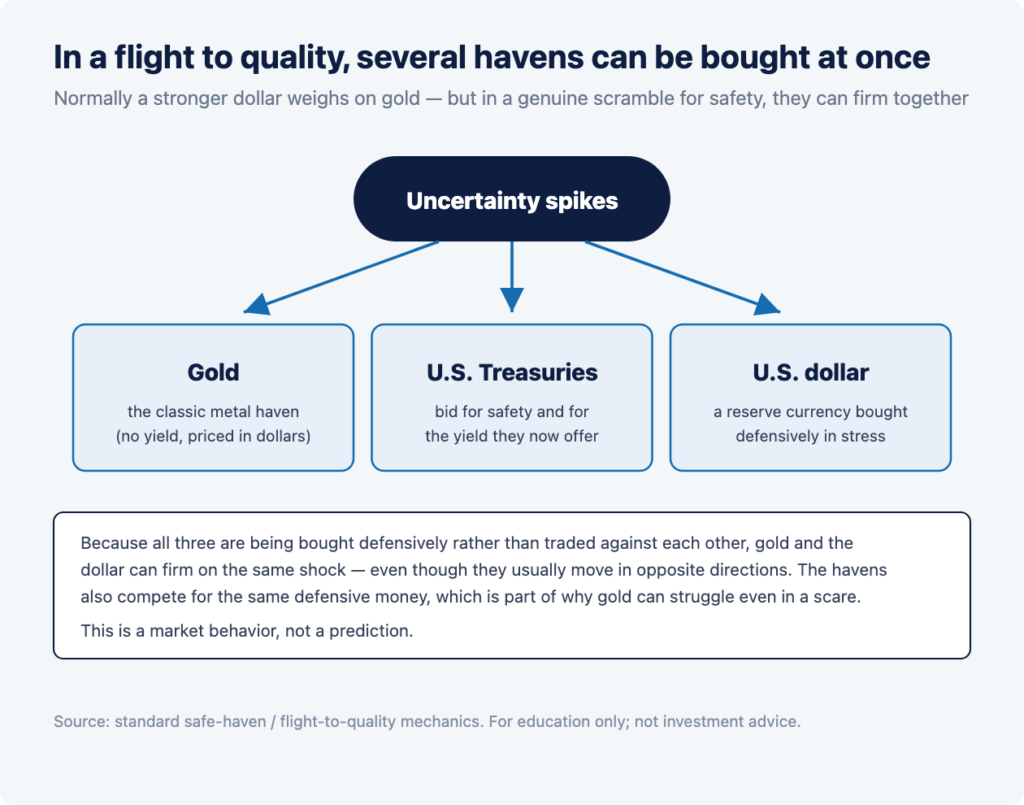
An acute stress episode can scramble those relationships, and this is the “twist” that surprised some observers in July 2026. In a genuine flight to quality, money can flow into gold and into the dollar and into Treasuries at the same time, because all three are being bought as havens rather than being traded against each other. That is why it is possible to see gold firm and the dollar firm on the very same shock, even though they normally move in opposite directions.
When havens compete
When several havens are bid at once, they also compete for the same defensive money. In July 2026, the dollar and Treasuries drew strong safe-haven and rate-driven demand, and that competition — combined with the higher real yields those Treasuries now offered — is part of why gold struggled to hold its bid. A trader watching only the gold headline would have missed that the dollar and the bond market were absorbing much of the defensive flow.
The takeaway for reading the tape
The practical lesson is to watch the complex, not the single price. Gold’s move on any given shock day is easier to understand when you also know what the dollar and real yields did. On a day when both of those rose, gold faced a stiff headwind no matter how large the geopolitical fear.
Real yields: gold’s most important cross-current
If there is one number to watch alongside gold, many market participants would point to the real yield — the yield on an inflation-protected Treasury, such as the 10-year Treasury Inflation-Protected Security (TIPS). The real yield is the return an investor earns above expected inflation, and it is the cleanest measure of the opportunity cost of holding gold.
The logic is straightforward. Gold produces no income. If a safe, inflation-protected government bond offers a rising real return, then holding a zero-yield asset like gold becomes relatively less attractive, and vice versa. That is why gold and real yields have, over long stretches, tended to move in opposite directions: falling real yields have often accompanied a firmer gold price, and rising real yields have often been a drag.
During the early-July 2026 episode, the 10-year real yield rose, per FRED data on inflation-protected Treasuries. A rising real yield is precisely the environment in which gold tends to struggle, and it helps explain why the geopolitical bid could not carry the metal to new highs. None of this predicts where gold or real yields go next; it describes the relationship that was working against gold at the time.
Reading real yields on the day
On a data or event morning, traders often watch the real yield alongside gold in real time, because the two frequently move together within the session. A sharp move higher in the real yield can cap a gold rally even as a geopolitical headline is still hitting the wires, and a fall in the real yield can support gold when nothing else obvious is happening. This is a relationship to observe, not a signal to act on, and it holds far more loosely intraday than it does over long stretches.
Short-term shocks versus gold’s longer-run drivers
The tug-of-war described so far is mostly about the short term — how gold trades in the days around a shock. Over longer horizons, a different and partly overlapping set of forces shapes the metal, and separating the two helps a trader avoid confusing a multi-day move with a multi-year one.
Three longer-run drivers come up repeatedly in how the market discusses gold:
- Real yields over time. The same opportunity-cost logic that matters day to day also operates over years. Extended periods of low or falling real yields have tended to be a supportive backdrop for gold, and periods of rising real yields a more challenging one.
- The dollar’s longer arc. Because gold is priced in dollars, sustained dollar strength or weakness is a slow but persistent influence, separate from any single day’s haven flows.
- Official-sector and investment demand. Central banks and long-term investors are meaningful holders of gold, and shifts in that demand — reported with a lag by industry bodies — can shape the multi-year picture in a way a single headline cannot.
None of these is a trading signal, and none predicts a price. The reason to hold them in mind is perspective. A geopolitical spike is a short-term input layered on top of these slower forces, and the two can point in different directions: gold can be in a multi-year uptrend and still fall for a week on rising real yields, or drift for months and still spike for a day on a shock. Conflating the timeframes — treating a one-day haven move as evidence about the long run, or the reverse — is a common error. For an active trader, the relevant question is almost always the short-term tug-of-war; the longer-run drivers are context, not a forecast.
The recent cross-currents, in data
The table below shows the cross-currents around gold in early July 2026: the geopolitical bid on one side, and rising real yields and a firmer dollar on the other. Interest-rate and dollar figures are from FRED; the gold level is attributed to dated market reporting.
| Measure | Move over the episode | What it means for gold |
| Gold (spot, per ounce) | ~$4,200 in mid-June to ~$4,000–$4,100 in early July (attributed) | Volatile; came off its highs despite the shock |
| 10-year Treasury yield | 4.38% (Jun 26) to 4.56% (Jul 8) | Higher yields, a headwind |
| 10-year real yield (TIPS) | 2.16% (Jun 29) to 2.31% (Jul 8) | Higher real yield raises gold’s opportunity cost |
| Broad U.S. dollar index | firmer into late June (about 121) | A stronger dollar is a headwind |
Read together, the table tells the story the single gold headline does not: the haven bid was real, but it was fighting rising real yields and a firmer dollar, and that is why gold could not simply rise. These are dated figures for one episode, shown to illustrate the mechanics — not a projection of any of these markets.
How do equity traders access the gold complex?
Most active traders do not buy and store physical bullion. They get exposure to gold through instruments that trade like any other security, each with its own mechanics and risks:
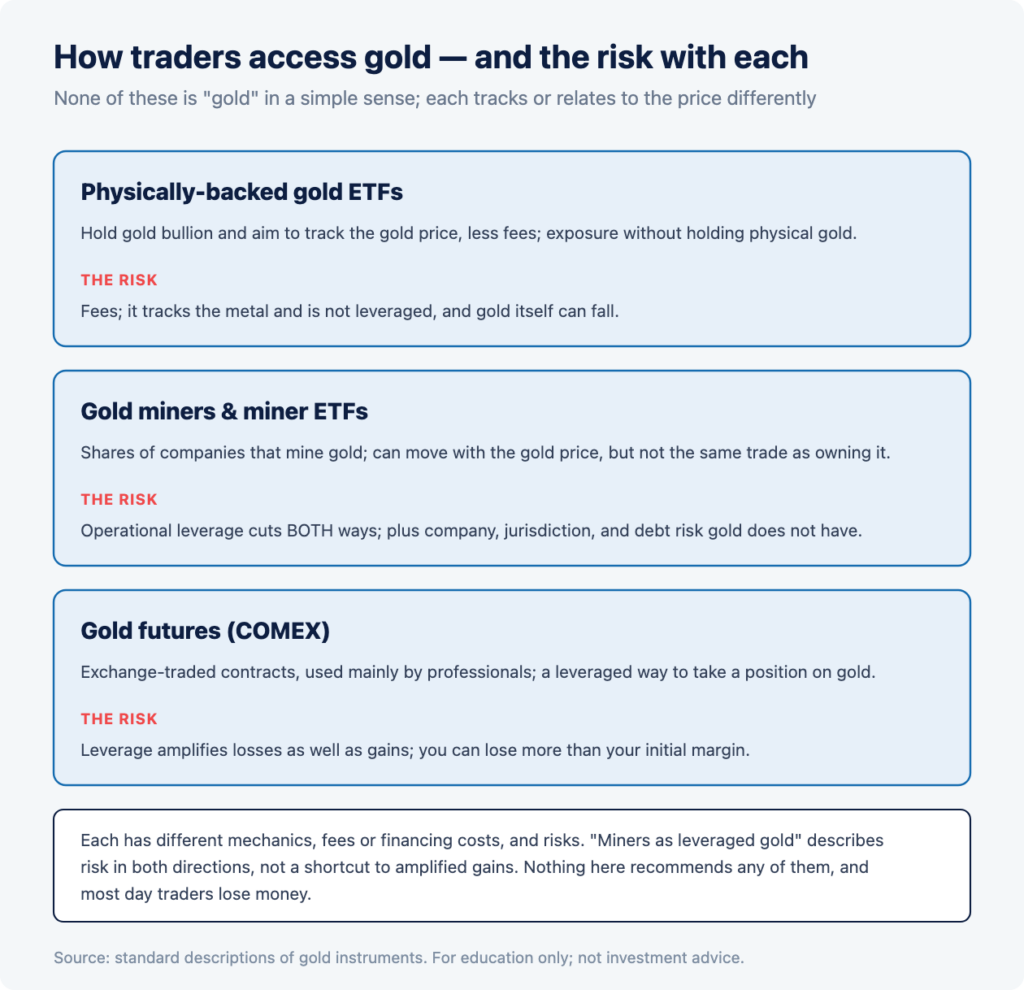
fees), gold miners and miner ETFs (operational leverage that cuts both ways, plus company risk), and gold futures
- Physically-backed gold ETFs. These funds hold gold bullion and aim to track the gold price, less fees. The largest and most-traded example is commonly cited as SPDR Gold Shares (ticker GLD), named here as a factual example of the category, not a recommendation. Such ETFs give exposure to the metal’s price without the trader holding physical gold.
- Gold-miner equity ETFs and individual miners. These provide exposure to the shares of companies that mine gold, rather than to the metal itself. They can move with the gold price but also carry company-specific and operational risk (discussed below), and they are not the same trade as owning gold.
- Gold futures. Traded on exchanges such as COMEX, futures are leveraged instruments used mainly by professionals; leverage amplifies both gains and losses, and you can lose more than your initial margin.
None of these is “gold” in a simple sense. Each tracks or relates to the gold price differently, carries fees or financing costs, and involves its own risks. The choice of instrument is a factual decision about mechanics, and nothing here recommends any of them.
Miners: operational leverage cuts both ways
Gold-mining shares deserve their own note because traders often treat them as a higher-octane way to trade gold, and that framing hides a real risk. A miner’s costs — labor, energy, equipment — are relatively fixed in the short run, while its revenue moves with the gold price. That combination creates operational leverage: a given percentage move in gold can produce a larger percentage move in the miner’s profit margin, and therefore, potentially, in its stock.
That leverage-like behavior is exactly why it must be understood as a two-way risk, not a benefit. Operational leverage amplifies the downside as much as the upside: if gold falls, a miner’s margins can compress faster than the metal’s price drops, and the stock can fall more than gold. Miners also carry risks gold does not — mine-specific problems, jurisdiction and political risk, debt, management, and hedging decisions — so a miner can underperform gold even when the metal rises.
The point is not to steer a trader toward or away from miners. It is to be clear that “miners as leveraged gold” is a description of risk in both directions, not a shortcut to amplified gains. Leverage of any kind amplifies losses as well as gains, and you can lose more than you expect.
How have past shock episodes resolved?
Looking across past geopolitical and financial shocks, the one durable lesson is that safe-haven moves resolve in both directions, and often quickly. Some shocks have been followed by sustained gold strength; others have seen an initial haven spike fade within days as the news de-escalated or as competing forces — rates, the dollar, risk appetite — reasserted themselves.
The July 2026 episode is itself a clean example of the second pattern: a geopolitical bid that was repeatedly offset and that left gold volatile rather than trending. Earlier in the same stretch, coverage described gold giving back an early safe-haven gain to “heavy selling” as the rate and dollar picture turned less friendly.
The reason history matters here is risk, not prediction. Because haven rallies can reverse as fast as they form, a move that looks like a one-way trend can round-trip in a session or two. Nothing in the historical pattern tells you what the next shock will do; it tells you that assuming a shock means durable gold strength has often been wrong.
What do traders watch in the gold complex?
Factually, the inputs market participants tend to focus on when following gold around a shock:
1. Real yields. The 10-year real yield (TIPS) is the cleanest read on gold’s opportunity cost; rising real yields are a headwind, falling ones a tailwind.
2. The U.S. dollar. Because gold is priced in dollars, the dollar’s direction is a constant cross-current.
3. Fed and rate expectations. A more hawkish path tends to firm both real yields and the dollar; a more dovish path tends to ease both. The July 2026 Fed minutes were a focal point for exactly this reason; our 2026 rate-cut cycle pillar covers how those expectations are read.
4. ETF flows and positioning. Flows into and out of physically-backed gold ETFs are one gauge of investment demand, though they are reported with a lag.
5. The geopolitical headline itself. Escalation and de-escalation can move the haven bid quickly in either direction.
Watching these inputs is a way to understand gold’s environment. It is not a system for predicting the price, and none of these signals tells you which way gold will trade.
Risks
Trading gold and gold-related instruments involves substantial risk. Gold has no yield and no cash flows, and its price can move sharply in either direction; a “safe haven” is a market behavior, not a guarantee of safety or a protection of capital. Safe-haven rallies can reverse quickly — a geopolitical move that lifts gold one day can unwind the next on de-escalation, as the July 2026 episode illustrated.
The instruments used to trade gold carry their own risks. Gold-mining shares add company, operational, and jurisdiction risk and can move more than gold in both directions. Futures are leveraged, and leverage amplifies losses as well as gains, so you can lose more than you deposit. Reactions around scheduled events, such as Fed communications, land fast and can reverse, and premarket and after-hours liquidity is thinner than in regular trading.
Prices can move sharply and unpredictably, and most day traders lose money. Nothing on this page is a recommendation to buy, sell, or hold gold, any gold ETF, any miner, or any security, and nothing here forecasts the price of gold or any market.
FAQ
Why is gold going up?
In a shock, safe-haven demand can lift gold — but it does not always, and it is not a rule. Gold’s price is a tug-of-war between that haven bid and cross-currents like real yields, the dollar, and Fed expectations. In early July 2026, those cross-currents (a firmer dollar and higher real yields) offset the U.S.-Iran safe-haven bid, and gold was volatile rather than in a clean rally. This is a description of the mechanics, not a forecast.
What is a safe-haven asset?
“Safe haven” is the market’s term for an asset money tends to rotate toward when uncertainty rises — gold, U.S. Treasuries, and sometimes the dollar or yen. It describes a market behavior, a flight-to-quality pattern, not a guarantee of safety. Havens can and do fall.
Why do gold and the dollar sometimes rise together?
Normally a stronger dollar weighs on gold. But in an acute flight to quality, money can flow into several havens at once — gold, the dollar, and Treasuries — because all are being bought defensively rather than traded against each other. That is why they can firm on the same shock, as they did in July 2026.
How do real yields affect gold?
Gold pays no interest, so when inflation-adjusted (real) Treasury yields rise, the opportunity cost of holding gold rises, which tends to be a headwind. When real yields fall, gold tends to find support. Real yields rose during the early-July 2026 episode, which worked against gold.
How can a trader get exposure to gold?
Through physically-backed gold ETFs (which hold bullion and track the price, less fees), gold-miner equity ETFs or individual miners (which add company and operational risk), or gold futures (leveraged, mainly for professionals). Each has different mechanics and risks, and none is a recommendation.
Are gold miners a leveraged bet on gold?
Miners have operational leverage: because their costs are relatively fixed, a move in the gold price can have an amplified effect on their margins. But that cuts both ways — it amplifies downside as well as upside — and miners carry extra risks (operational, jurisdiction, debt) that gold does not, so they can underperform even when gold rises.
Is gold a safe investment?
No asset is “safe,” and gold is not an exception. It has no yield, it can fall sharply, and it came off its highs even during the July 2026 safe-haven episode. Gold is called a “safe haven” because of how money tends to rotate in stress, not because it protects capital.
Disclosures: Trading involves substantial risk and is not suitable for every investor. Gold and gold-related instruments can be highly volatile; a “safe haven” describes a market behavior, not a guarantee of safety, and gold can fall sharply. Gold-mining shares carry company, operational, and jurisdiction risk and can move more than gold in either direction. Leverage and futures amplify both gains and losses, and you can lose more than you deposit. Capital is at risk and most day traders lose money. Client accounts are not SIPC or FSCS insured. This content is provided for information and education only. It is not investment advice or a recommendation of any security, and it does not predict the price of gold or any market. Interest-rate and dollar figures are from FRED; the gold price level and market narrative are attributed to dated market reporting as described above. See our full disclosures and policies.
<!– CMS: NewsArticle schema — headline, datePublished, dateModified (update on the next shock/episode), publisher=CMEG, about=”Gold and safe-haven trades”. FAQPage schema on the FAQ block. Internal links to wire at publish: “oil-shock article” → Oil & Geopolitics article; “2026 rate-cut cycle pillar” → Rate-Cut Cycle pillar; indexes Knowledge Hub page; disclosures → /policies/. –>
<!– PUBLISH-DAY REFRESH BOX (event-refreshed):
1. Re-pull FRED DGS10, DFII10, DTWEXBGS and refresh the cross-currents table; re-check the attributed gold level against current market reporting (name the outlet + date).
2. Update the “What’s moving gold” case study to the current episode if the news has moved; keep the mechanics sections (flight-to-quality, real yields, dollar, miners, access points) evergreen.
3. Update the “as of” stamp. Do NOT add a gold forecast or a direction call; keep “safe haven” as the market’s term, never “gold is safe.”
4. If gold’s move flips (e.g., a sustained rally), report it as attributed facts and keep the two-sided tug-of-war framing.
–>