


Published September 2026. Figures are historical and may no longer reflect current market conditions.
The Unemployment Insurance Weekly Claims report is released by the U.S. Department of Labor’s Employment and Training Administration at 8:30 a.m. Eastern Time every Thursday. It reports initial claims for the week ending the previous Saturday and continued claims for the week before that. In the week ending 22 August 2026, seasonally adjusted initial claims were 203,000.[^1]
When is the jobless claims report released?
The report is published every Thursday at 8:30 a.m. Eastern Time. Materials are embargoed until that moment, and the release carries the embargo notice on its first line.[^1]
That timing places it one hour before the New York equity open, in the same 8:30 a.m. slot used by several other US data releases. Because it arrives weekly rather than monthly, it is the most frequent scheduled economic release on the US calendar, which is a large part of why it is followed at all: no other federal labour-market series updates this often.
The Thursday pattern holds except in weeks containing a federal holiday, when the release is generally brought forward. Between September and December 2026 there is one such shift.
Month | Release dates (all 8:30 a.m. ET) | Notes |
| September 2026 | 3, 10, 17, 24 | All Thursdays |
| October 2026 | 1, 8, 15, 22, 29 | All Thursdays |
| November 2026 | 5, 12, 19, 25 | 25 November is a Wednesday – moved forward for Thanksgiving |
| December 2026 | 3, 10, 17, 24, 31 | All Thursdays |
The 25 November date is the one exception in this window and is worth noting in advance: the release lands a day earlier than usual, alongside a compressed calendar of other data brought forward around the holiday.[^2]
What does the initial claims number actually count?
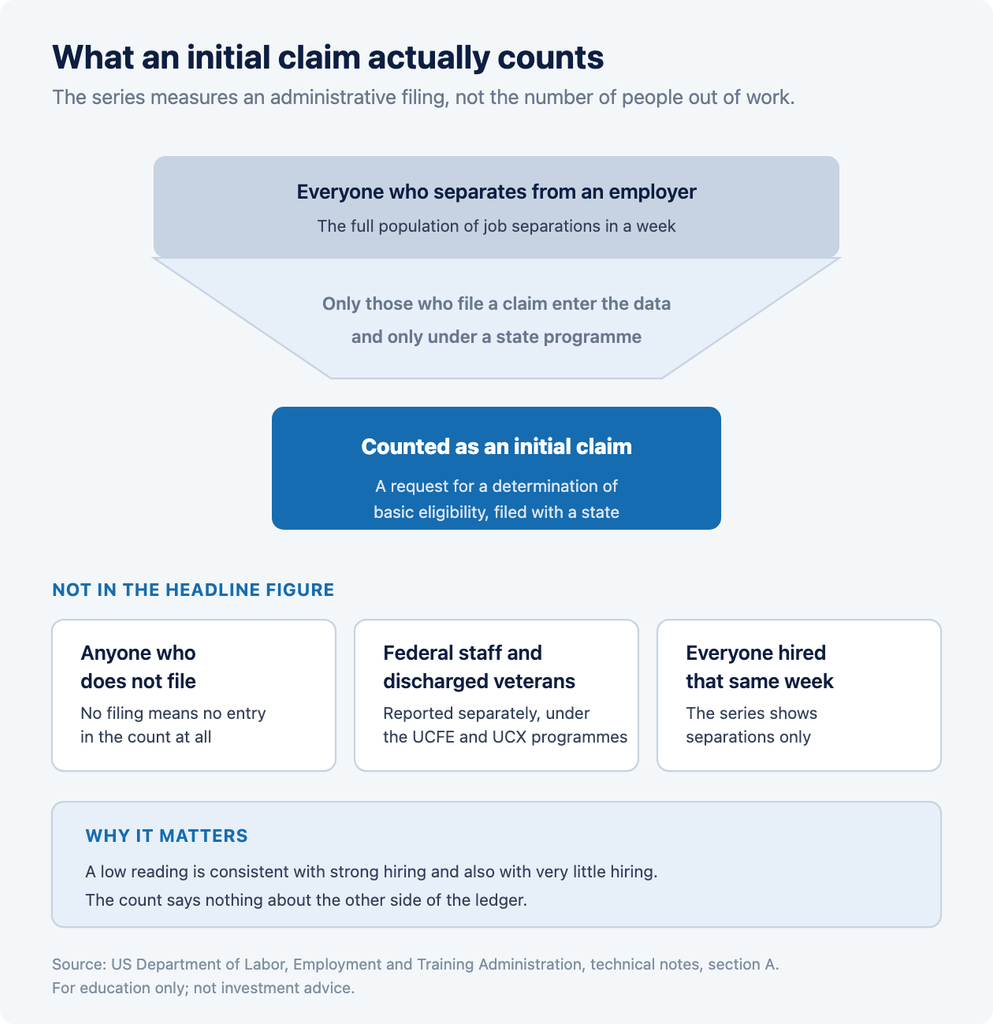
An initial claim is a claim filed by an unemployed individual after a separation from an employer, in which the claimant requests a determination of basic eligibility for the unemployment insurance programme.[^1]
Three things follow from that definition, and each one shapes how the number should be read.
First, it counts filings, not people out of work. Someone who loses a job but does not file is not in the data. Someone who files and is later found ineligible still is. The series measures an administrative event.
Second, it counts separations, not net employment change. A week in which 200,000 people file and 300,000 are hired produces the same initial claims figure as a week with no hiring at all. The series says nothing directly about the other side of the ledger.
Third, it is state programme data aggregated federally. Each state’s unemployment insurance office reports its own counts, which are then compiled. Federal employees and recently discharged service members are counted separately, under the UCFE and UCX programmes, and are not included in the headline state figure.[^1]
The Department of Labor describes the count of US initial claims as a leading economic indicator, on the basis that it gives an early reading on emerging labour-market conditions. The same technical note adds an important qualification in the next sentence: these are weekly administrative data that are difficult to seasonally adjust, which makes the series subject to some volatility.[^1] Both halves of that statement come from the same paragraph of the source, and reading one without the other tends to produce overconfidence in any single week’s print.
How do initial claims differ from continued claims?
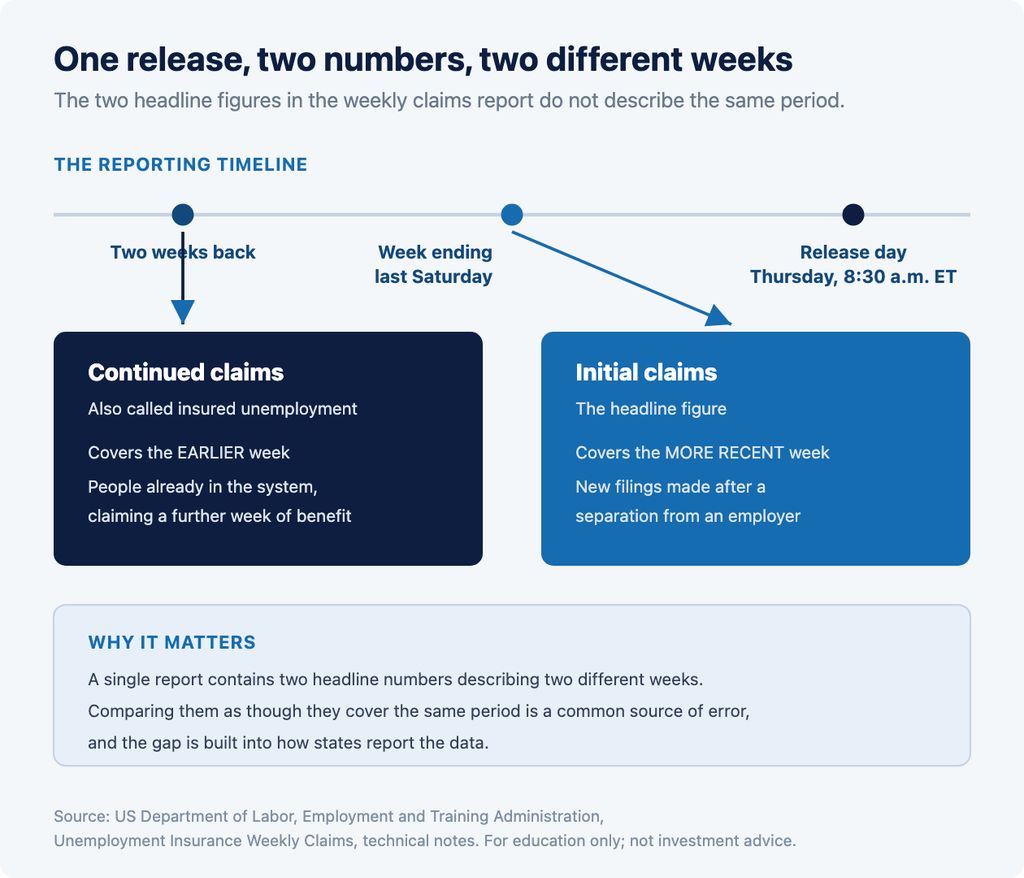
The two figures in the release describe different stages of the same process, and they are published for different weeks.
Initial claims are new filings following a separation. Continued claims – also called insured unemployment – are filed by someone who has already made an initial claim and who is claiming benefits for a further week of unemployment. Continued claims are a reasonable approximation of the number of insured unemployed workers currently receiving benefits.[^1]
The distinction that matters most is in what each one signals. The Department of Labor characterises continued claims as a good indicator of labour-market conditions but explicitly not a leading one: they roughly coincide with economic cycles at their peaks and lag at cycle troughs, providing confirming rather than early evidence of direction.[^1]
There is also a reporting-lag difference that is easy to miss. In any given release, the initial claims figure covers the week ending the previous Saturday, while the continued claims figure covers the week before that. The two headline numbers in a single report describe two different weeks.
| Initial claims | Continued claims (insured unemployment) | |
| What it counts | New filings after a separation from an employer | Weeks of benefits claimed by those already filed |
| Week covered | Week ending the previous Saturday | The week before that |
| Cycle relationship | Described as a leading indicator | Coincides at peaks, lags at troughs |
| Typical scale (2026) | Around 200,000 per week | Around 1.8 million |
| Also published as | 4-week moving average | Insured unemployment rate, 4-week average |
Because continued claims count weeks claimed rather than individuals, one person unemployed for four weeks contributes four continued weeks claimed across four reports. The Department of Labor states this directly in its footnotes: continued weeks claimed represent all weeks of benefits claimed during the week being reported, and do not represent weeks claimed by unique individuals.[^1]
What did the most recent report show?
The release issued on 27 August 2026 (release number USDL 26-1430-NAT) covered the week ending 22 August.
| Measure | Latest | Prior week | Change | Year earlier |
| Initial claims, seasonally adjusted | 203,000 | 207,000 (revised) | -4,000 | 229,000 |
| Initial claims, not seasonally adjusted | 169,786 | 173,017 | -3,231 | 191,208 |
| 4-week moving average | 205,500 | 204,250 (revised) | +1,250 | 228,000 |
| Insured unemployment, seasonally adjusted | 1,778,000 | 1,796,000 (revised) | -18,000 | 1,942,000 |
| Insured unemployment rate | 1.2% | 1.2% | 0.0 | 1.3% |
Two features of that table are worth drawing out, because they recur in every release.
The seasonally adjusted and unadjusted figures differ substantially – 203,000 against 169,786 for the same week. Neither is wrong; they answer different questions, and the gap between them is the seasonal factor at work.
The prior week was revised. The initial claims figure for the week ending 15 August was revised up by 1,000, from 206,000 to 207,000, and the 4-week average was revised up by 250. Revisions of this size are routine, and they mean the “change from prior week” in any release is measured against a number that has itself moved since it was first published.
The most visible consequence appears in the headline arithmetic: initial claims fell by 4,000 while the 4-week moving average rose by 1,250 in the same release. Those two statements are not in conflict. They describe different windows.
Why is the weekly series so volatile?
The Department of Labor attributes the volatility directly to the nature of the data: these are weekly administrative counts that are difficult to seasonally adjust.[^1]
Several mechanical sources of week-to-week movement sit underneath that. Plant shutdowns and retooling weeks concentrate filings into single weeks in particular states. School-year start and end dates move support-staff filings. Severe weather in one large state can move the national figure on its own. Holidays shift both filing behaviour and the number of processing days in a week.
The state-level detail in each release makes these effects visible. In the week ending 15 August 2026, the largest decreases were in Michigan (-2,446), California (-1,432), South Carolina (-1,136) and Pennsylvania (-1,077). Michigan’s own comment on the change attributed it to fewer layoffs in the manufacturing industry, and Pennsylvania’s to fewer layoffs in health care and social assistance, transportation and warehousing, and administrative and support services.[^1] A single state’s industrial calendar moved the national number by more than one per cent that week.
This is the practical reason the four-week moving average is published alongside the weekly figure.
What is the difference between the advance figure and the revised figure?
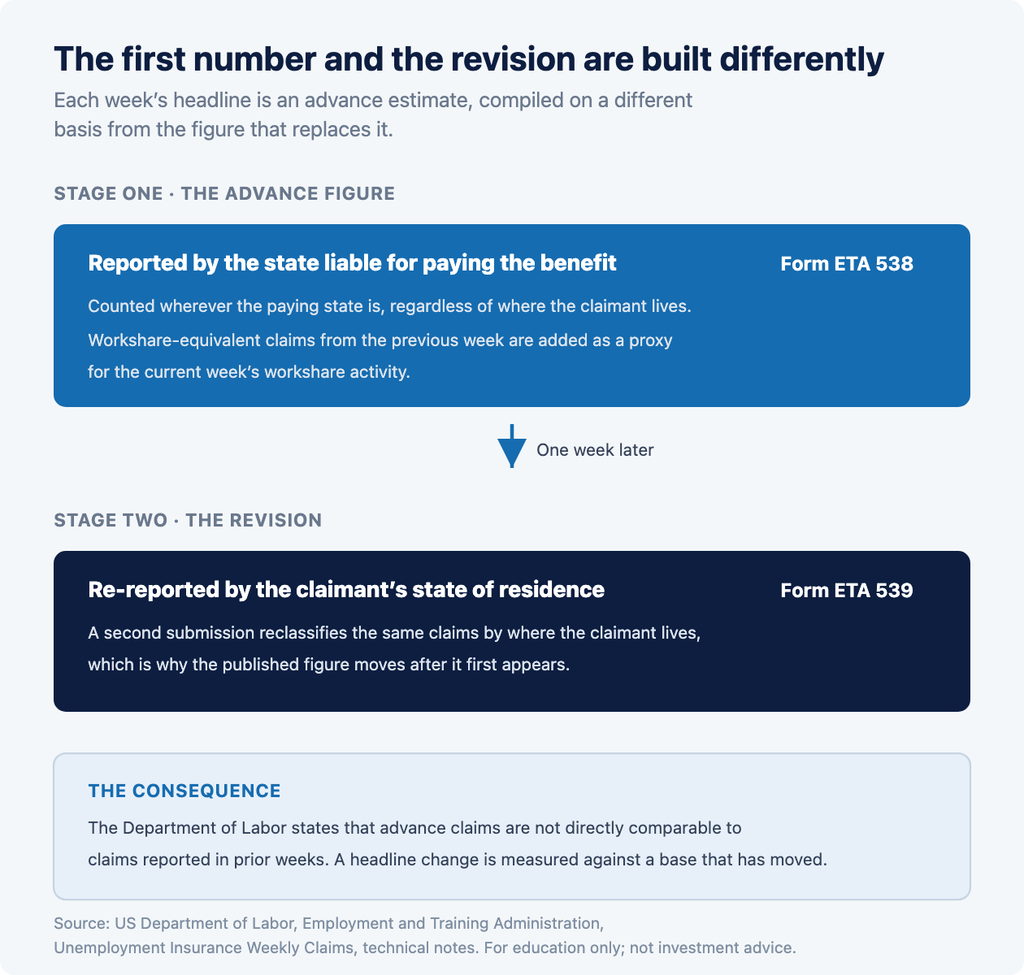
Each week’s headline number is an advance figure, and it is not constructed the same way as the revised figure that replaces it.
States initially report claims taken by the state liable for paying the benefit, regardless of where the claimant lives. These reports arrive via form ETA 538 and become the advance initial and continued claims published each week. The following week, the figures are revised on the basis of a second reporting that reflects claimants by state of residence, submitted via form ETA 539.[^1]
The Department of Labor states the implication plainly in a note attached to its state table: advance claims are not directly comparable to claims reported in prior weeks, because the two are compiled on different bases. Claims reported as “workshare equivalent” in the previous week are additionally added to the advance claims as a proxy for the current week’s workshare activity.[^1]
For anyone comparing a fresh headline against last week’s state-level detail, that note is the one to keep in view: the comparison is not quite like for like until the revision lands.
How does seasonal adjustment change the number?
Seasonal adjustment exists because the weekly level of claims fluctuates in regularly recurring patterns driven by weather, major holidays, school openings and closings, and similar events. Because these follow a broadly repeating annual pattern, their influence can be tempered, which makes trend and cycle developments easier to identify.[^1]
The mechanism is worth knowing because it is not run by the Department of Labor alone. At the beginning of each calendar year, the Bureau of Labor Statistics provides the Employment and Training Administration with a set of seasonal factors to apply to the unadjusted data during that year. When the new factors are implemented, the historical series is also revised to reflect updates to the unadjusted data.[^1]
Two consequences follow. Each January, the entire adjusted history can shift slightly. And within any year, the reported “change” partly reflects how the actual movement compared with what the seasonal factors had expected. The 22 August 2026 release makes this explicit: unadjusted claims decreased by 3,231, while the seasonal factors had expected a decrease of 207.[^1] The adjusted series registered a decline because the fall was larger than the pattern anticipated.
What is the four-week moving average used for?
The four-week moving average is published in the same table as the weekly figure and smooths the series by averaging the latest four weeks.
Its purpose follows from the volatility described above. A single week can be moved by one state’s shutdown calendar; four weeks averaged together are less exposed to any one such event. The trade-off is responsiveness – the average turns later than the weekly series, by construction.
Across 2026 to date, the smoothing effect is visible in the range. Weekly seasonally adjusted initial claims ran between roughly 189,000 and 230,000, while the four-week average moved through a narrower band. In the release covering 22 August 2026, the weekly figure was 203,000 and the four-week average 205,500.[^1]
| Week ending | Initial claims (SA) | 4-week average |
| 20 June 2026 | 216,000 | 224,500 |
| 27 June 2026 | 217,000 | 222,500 |
| 4 July 2026 | 217,000 | 219,250 |
| 11 July 2026 | 209,000 | 214,750 |
| 18 July 2026 | 189,000 | 208,000 |
| 25 July 2026 | 198,000 | 203,250 |
| 1 August 2026 | 200,000 | 199,000 |
| 8 August 2026 | 212,000 | 199,750 |
| 15 August 2026 | 207,000 | 204,250 |
| 22 August 2026 | 203,000 | 205,500 |
The week ending 18 July illustrates the point. At 189,000 it was the lowest weekly print in the window, yet the four-week average that week stood at 208,000 and continued to decline for a further two weeks before turning. A reader taking the single week as the signal and a reader taking the average would have reached different conclusions about timing.
What else is in the release beyond the headline?
The two headline numbers are a small part of what the Department of Labor publishes each Thursday. The full release runs to nine pages, and several of the additional tables carry information that never reaches the summary coverage.
Federal programme claims are reported separately. Initial claims filed by former federal civilian employees, under the Unemployment Compensation for Federal Employees programme, totalled 390 in the week ending 15 August 2026, a decrease of 59 from the prior week. Initial claims filed by newly discharged veterans, under the Unemployment Compensation for Ex-servicemembers programme, totalled 385, a decrease of 104.[^1] Neither is included in the headline state figure, and both exclude claims filed jointly under other programmes so that the same claim is not counted twice.
A wider continued-claims total is published for all programmes combined. For the week ending 8 August 2026 this stood at 1,817,931, a decrease of 21,217 from the previous week, against 1,987,368 in the comparable week a year earlier.[^1] That total gathers regular state programmes, federal employees, discharged veterans, Extended Benefits, state additional benefits, and short-time compensation or workshare arrangements, which accounted for 14,669 continued weeks in that week.
Extended Benefits activity is reported explicitly, including when there is none. The release for the week ending 8 August 2026 recorded that no state was triggered “on” the Extended Benefits programme.[^1] The programme activates in individual states when specified unemployment thresholds are met, so the line is a standing indicator that reads zero in most conditions.
State-level tables cover every state and territory. Each release lists initial claims and insured unemployment for all fifty states plus the District of Columbia, Puerto Rico and the Virgin Islands, together with week-on-week changes. It separately identifies the states with the largest increases and decreases, and prints the explanatory comments those states choose to supply.
The insured unemployment rate is also broken out by state, and the dispersion is wide. For the week ending 8 August 2026 the highest rates were recorded in New Jersey and Puerto Rico (both 2.6 per cent), Rhode Island (2.2), Massachusetts and Minnesota (both 2.1), Oregon (2.0), California and Washington (both 1.9), Connecticut, New York and Pennsylvania (all 1.7) and Nevada (1.6), against a national rate of 1.2 per cent.[^1] A national figure of that kind aggregates considerable variation between individual state labour markets.
What the weekly claims data does not show
Several limitations follow from how the series is constructed, and they bound what can reasonably be concluded from any single release.
It does not count unemployed people. It counts filings under state unemployment insurance programmes. Workers who are ineligible, whose benefits have been exhausted, who are self-employed, or who simply do not file are outside the data entirely. The insured unemployment rate of 1.2 per cent is calculated against covered employment of 153,732,307 and measures only those receiving benefits under state programmes[^1] – it is a narrower measure than the headline unemployment rate published monthly, and the two are not interchangeable.
It says nothing about hiring. The series records separations entering the benefit system. A week of low initial claims is consistent with strong hiring and also with a labour market in which few people are being hired and few are being let go.
It does not distinguish between causes of separation. A filing following a seasonal plant shutdown and a filing following a permanent closure appear identically in the count.
A single week carries limited information. This follows from the Department of Labor’s own characterisation of the data as difficult to seasonally adjust and subject to some volatility,[^1] and from the size of the state-level swings visible in any release – a single state moved the national figure by more than one per cent in the week ending 15 August 2026.
The first print is provisional. The advance figure is compiled on a different basis from the revision that replaces it a week later, and the Department of Labor states directly that the two are not directly comparable.[^1]
How the market commonly reads the release
Market participants generally treat the weekly claims figure as one input among several rather than as a standalone reading, and commentary around it tends to concentrate on a few recurring points.
The four-week average relative to the weekly print is commonly referenced when the two diverge, as they did in the 27 August release. Commentary frequently distinguishes a single-week move from a change in the smoothed trend.
The revision to the prior week is routinely noted, since the headline change is measured against a revised base. A figure described as a decline from the previous week may reflect an upward revision to that week as much as a fall in the current one.
Continued claims are often discussed alongside initial claims because the two describe different stages. Commentary sometimes distinguishes between the rate at which people are entering the benefit system and the rate at which they are leaving it, the second of which is more closely associated with the continued claims series.
State-level detail is available in every release and is used to identify whether a national move was broad-based or concentrated. The Department of Labor publishes both the largest increases and decreases by state and, where states supply them, their own explanatory comments.[^1]
The insured unemployment rate is published in the same table and is calculated against covered employment, which stood at 153,732,307 in the most recent release.[^1] It is a narrower measure than the headline unemployment rate published monthly, because it counts only those receiving benefits under state programmes.
None of these are recommendations, and the relationship between any data release and subsequent price movement is neither fixed nor reliable. Data of this kind is commonly interpreted alongside other releases, and interpretations differ between market participants.
How does it relate to the monthly jobs report?
The two are separate releases from separate agencies measuring different things, and conflating them is a common error.
The Employment Situation report – the monthly jobs report – is published by the Bureau of Labor Statistics and draws on two surveys, one of households and one of employers. Weekly claims are administrative counts compiled by the Employment and Training Administration from state unemployment insurance offices. Neither is derived from the other.
The frequency difference is the practical one. Claims arrive weekly; the Employment Situation arrives monthly. Between two monthly reports there are typically four or five claims releases, which is the reason the weekly series is followed as an interim reading despite its volatility.
The reference-period difference matters too. The monthly household survey references the week containing the twelfth of the month. Weekly claims reference the week ending the previous Saturday. A claims figure and a monthly report published in the same period may be describing different stretches of time.
Where does the data come from, and how can it be verified?
Every figure in this article traces to the Department of Labor’s own release, which is published free of charge and requires no subscription.
The current release is posted at dol.gov/ui/data.pdf. That address always serves the most recent week, so the release number is the reliable identifier for a specific report – the figures above come from USDL 26-1430-NAT, issued 27 August 2026. The permanent archive of past releases is maintained at oui.doleta.gov/unemploy/claims.asp.[^2]
The same series are also distributed through the Federal Reserve Bank of St. Louis FRED database under the identifiers ICSA (initial claims), IC4WSA (the four-week average) and CCSA (continued claims), which is convenient for retrieving history in bulk.[^3]
Frequently asked questions
What time is the jobless claims report released?
The Unemployment Insurance Weekly Claims report is released at 8:30 a.m. Eastern Time. Materials are under embargo until that moment. The release is issued every Thursday, except in weeks containing a federal holiday, when it is generally brought forward by one day.
What week does the jobless claims number cover?
The initial claims figure covers the week ending the Saturday before the release. The continued claims figure covers the week before that. A single report therefore contains two headline numbers describing two different weeks, which is a frequent source of confusion.
What is the difference between initial and continued claims?
Initial claims are new filings made after a separation from an employer. Continued claims are filed by people already in the system claiming benefits for a further week. The Department of Labor describes initial claims as a leading indicator and continued claims as coinciding at peaks and lagging at troughs.
Why do jobless claims get revised every week?
The first figure is an advance estimate reported by the state liable for paying benefits. The following week it is revised using a second report that reflects claimants by state of residence. The two are compiled on different bases, so the advance figure is not directly comparable to prior weeks.
What are jobless claims running at in 2026?
In the week ending 22 August 2026, seasonally adjusted initial claims were 203,000 with a four-week average of 205,500. Across 2026 to that date the weekly figure ranged between roughly 189,000 and 230,000. Insured unemployment stood at 1,778,000, an insured unemployment rate of 1.2 per cent.
Sources
[^1]: U.S. Department of Labor, Employment and Training Administration, Unemployment Insurance Weekly Claims, release number USDL 26-1430-NAT, issued 8:30 a.m. ET, 27 August 2026. Covers the week ending 22 August 2026. Includes seasonally adjusted and unadjusted figures, state-level detail, and the technical notes defining initial claims, continued weeks claimed, and the seasonal adjustment methodology. Available at https://www.dol.gov/ui/data.pdf (this address serves the latest release; cite the release number for a specific week).
[^2]: U.S. Department of Labor, Employment and Training Administration, Unemployment Insurance Weekly Claims Data archive, https://oui.doleta.gov/unemploy/claims.asp. Scheduled release dates cross-checked against the Federal Reserve Bank of St. Louis release calendar for the Unemployment Insurance Weekly Claims release, retrieved 31 August 2026.
[^3]: Federal Reserve Bank of St. Louis, FRED database, series ICSA (Initial Claims), IC4WSA (4-Week Moving Average of Initial Claims) and CCSA (Continued Claims, Insured Unemployment), retrieved 31 August 2026 via the FRED API. This endpoint requires an API key and is not publicly reproducible by clicking the link. API documentation: https://fred.stlouisfed.org/docs/api/fred/. The raw, unedited responses backing every figure drawn from this source are retained in this article’s evidence/ directory. Where a figure appears in both FRED and the Department of Labor release, the Department of Labor release is cited as the primary source.
Disclosures
This article is provided for informational and educational purposes only. It does not constitute investment advice, a recommendation, or an offer or solicitation to buy or sell any security or financial instrument. Nothing in this article should be relied upon as a basis for any trading decision.
Economic data releases are scheduled by the issuing agency and are subject to change, revision and delay. Figures cited are historical, were accurate as at the retrieval dates stated in the sources above, and may no longer reflect current conditions.
Trading in securities involves risk, including the possible loss of principal. Past performance and historical data are not indicative of future results.
Capital Markets Elite Group (KY) Limited is authorized by the Cayman Islands Monetary Authority.