

The Producer Price Index (PPI) is released by the U.S. Bureau of Labor Statistics at 8:30 a.m. Eastern Time. The next report, covering June 2026, is scheduled for Wednesday, July 15, 2026 — the morning after the June CPI report, which is why the market tends to read the two as a pair. PPI measures the prices producers receive, an earlier point in the pipeline than the consumer prices CPI tracks. This is factual reporting, not investment advice or a forecast of any number.
Data on this page is current as of July 10, 2026, and reflects the most recent PPI release (May 2026 data, published June 11, 2026). It is updated after each release.
What time is the PPI report released?
The PPI report is published at 8:30 a.m. ET on its scheduled release day, per the Bureau of Labor Statistics. That is one hour before the regular U.S. equity session opens at 9:30 a.m. ET, so the first market reaction to the number appears in index futures and in premarket trading, not in the regular session.
One hour before the open
Because the release lands during premarket hours, liquidity is thinner and spreads are typically wider than in regular trading. Fast moves in both directions, and quick reversals as the market digests the detail, are common in the first minutes after 8:30 a.m. ET.
The same window as CPI
PPI shares its 8:30 a.m. ET slot with the other major BLS inflation release, CPI, which lands the day before this cycle. Two inflation prints on back-to-back mornings is the setup traders are watching this week.
When is the next PPI report? (2026 schedule)
The next PPI release is Wednesday, July 15, 2026, at 8:30 a.m. ET, covering June 2026 data. PPI is published monthly, generally in the second week of the month following the reference month. The remaining 2026 schedule, per the BLS release calendar:
| Reference month | Release date | Time (ET) |
| June 2026 | July 15, 2026 | 8:30 a.m. |
| July 2026 | August 13, 2026 | 8:30 a.m. |
| August 2026 | September 10, 2026 | 8:30 a.m. |
| September 2026 | October 15, 2026 | 8:30 a.m. |
| October 2026 | November 13, 2026 | 8:30 a.m. |
| November 2026 | December 15, 2026 | 8:30 a.m. |
What did the last PPI report show?
The most recent release, published June 11, 2026 and covering May 2026, showed the PPI for final demand up 1.1% on the month (seasonally adjusted) and 6.5% over the prior 12 months (unadjusted), per the BLS. The 12-month figure was the largest since November 2022. [1]
The May 2026 numbers
- Final demand: +1.1% month-over-month (seasonally adjusted), the same as April and after +0.7% in March. [1]
- Final demand: +6.5% over 12 months (not seasonally adjusted), up from +5.7% for the 12 months ending April. [1]
- Core (final demand less foods, energy, and trade services): +0.8% on the month and +5.1% over 12 months, per the BLS. [1]
What moved inside the report
Per the BLS, nearly 80% of the May advance came from final demand goods, which rose 2.8% — the largest increase since the data series began in December 2009. Most of that was energy: the final demand energy index rose 10.7%, and gasoline prices rose 23.4%. Final demand services rose 0.3%. In the other direction, the index for pork fell 10.1%. [1]
These are the figures as published; they describe a past month and do not forecast the June number that arrives July 15.
What is PPI, and how is it different from CPI?
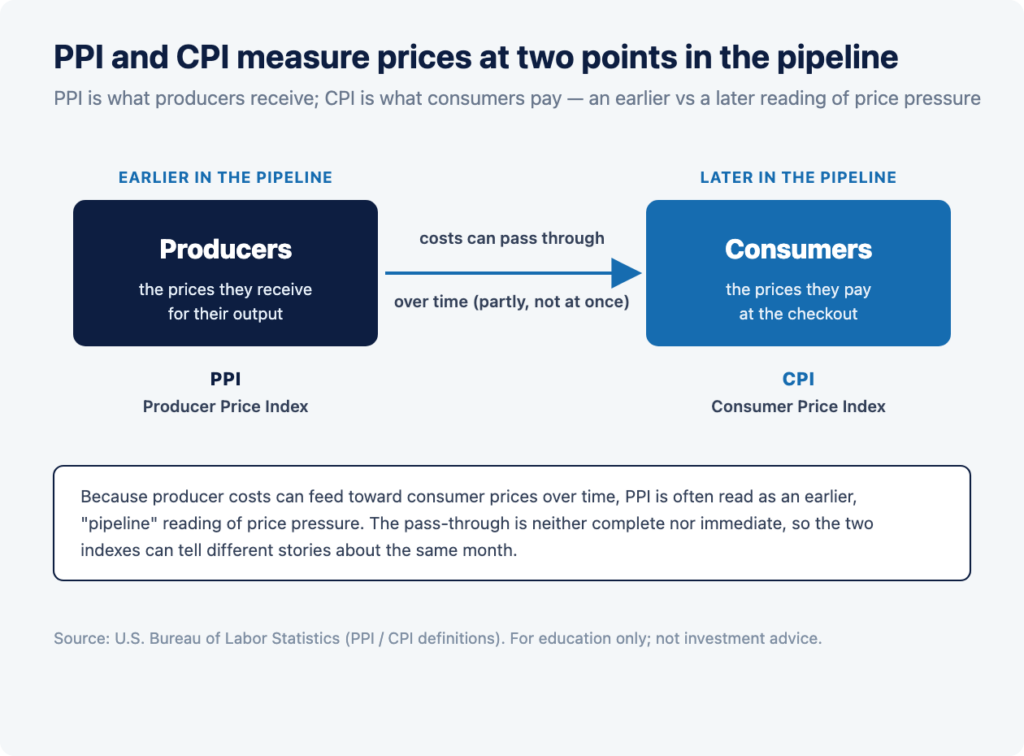
The Producer Price Index measures the average change over time in the selling prices that domestic producers receive for their output. The Consumer Price Index, by contrast, measures the prices consumers pay. That difference in vantage point is the whole point of watching both.
Producer prices sit earlier in the pipeline
PPI captures prices closer to the start of the supply chain — what producers charge — while CPI captures the end of it, at the checkout. Because costs can pass from producers toward consumers over time, PPI is often read as an earlier, “pipeline” reading of price pressure, though the pass-through is neither complete nor immediate.
Headline and core, seasonally adjusted vs not
Like CPI, PPI is reported as a headline number (final demand) and a core measure (here, final demand less foods, energy, and trade services). And, as with CPI, the monthly change is seasonally adjusted while the 12-month change is not — a distinction worth keeping straight when comparing figures, and the reason a monthly and an annual number can tell slightly different stories about the same month.
The CPI-PPI pair: why back-to-back days trade as one narrative
This cycle, CPI is released the morning of July 14 and PPI the morning of July 15 — two inflation prints on consecutive mornings, both at 8:30 a.m. ET. Market participants often read them together, because they measure the same underlying question, inflation, from two vantage points: what consumers pay and what producers receive.
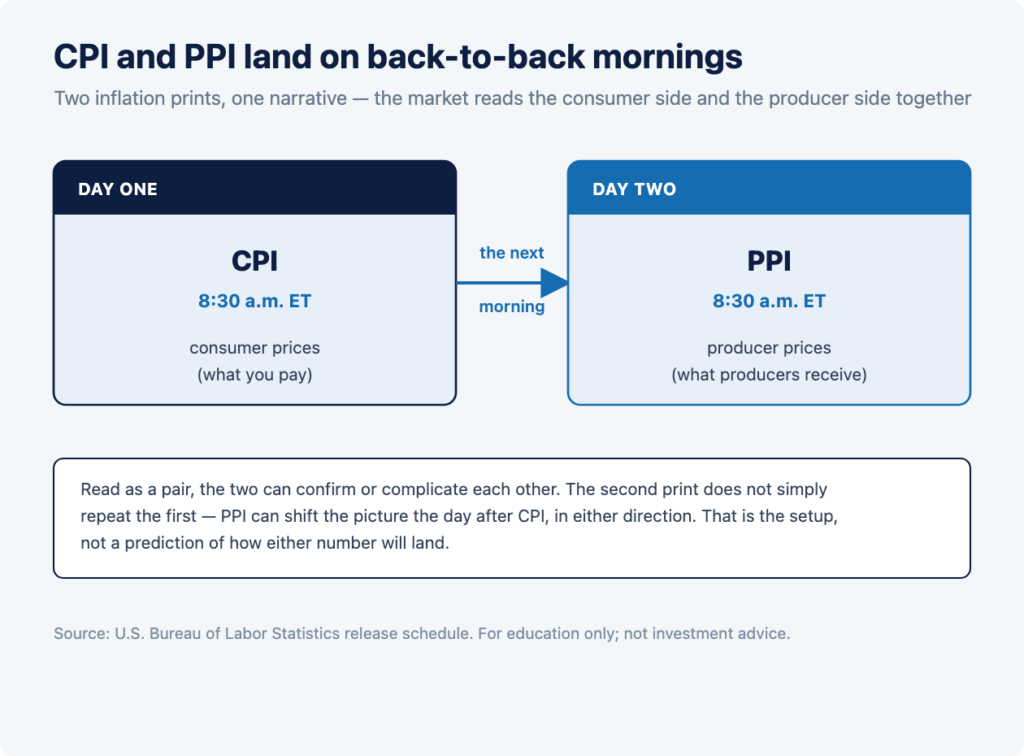
Read as a pair, the two can confirm or complicate each other. A consumer-price reading and a producer-price reading that point the same way build a cleaner narrative; ones that diverge leave more to interpret. Our CPI report hub covers the consumer side in the same detail. The important framing for a trader is that the second print does not simply repeat the first — PPI can shift the picture the day after CPI, in either direction, which is why the back-to-back setup draws attention.
How is PPI trending? (13-month history)
The table below shows final-demand PPI over the last 13 reported months: the monthly change (seasonally adjusted) and the 12-month change (not seasonally adjusted), as published by the BLS.
| Reference month | Monthly change (SA) | 12-month change (NSA) |
| May 2025 | +0.3% | +2.7% |
| June 2025 | +0.2% | +2.4% |
| July 2025 | +0.8% | +3.2% |
| August 2025 | −0.2% | +2.7% |
| September 2025 | +0.6% | +3.0% |
| October 2025 | +0.1% | +2.8% |
| November 2025 | +0.4% | +3.1% |
| December 2025 | +0.4% | +3.1% |
| January 2026 | +0.6% | +3.1% |
| February 2026 | +0.5% | +3.4% |
| March 2026 | +0.7% | +4.3% |
| April 2026 | +1.1% | +5.7% |
| May 2026 | +1.1% | +6.5% |
The 12-month rate rose from 2.7% in May 2025 to 6.5% in May 2026, with most of the acceleration in the spring of 2026. That is history as published, not a projection of where the June figure or any future figure will land.
How does the PPI report move rate expectations?
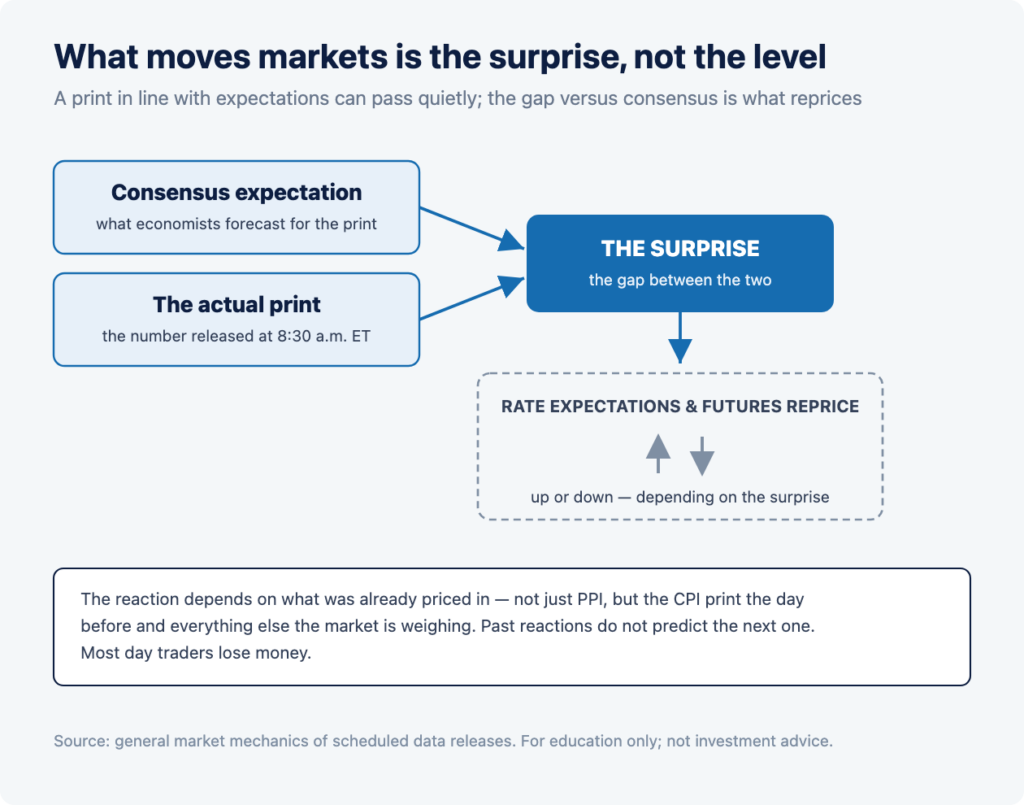
What moves prices on PPI morning is generally not the number itself but the number relative to expectations. Ahead of each release, economists publish consensus forecasts; a print in line with consensus may pass quietly, while a meaningful surprise tends to reprice rate expectations, and with them index futures and Treasury yields, within seconds of 8:30 a.m. ET.
The 2-year Treasury yield is a common read on near-term rate expectations. The table below shows where it sat the day before and the day of the last three PPI releases — historical context, not a forecast, and the moves shown are small.
| PPI release (reference month) | 2-yr yield, day before | 2-yr yield, release day |
| April 14, 2026 (March) | 3.78% | 3.76% |
| May 13, 2026 (April) | 4.00% | 3.98% |
| June 11, 2026 (May) | 4.13% | 4.05% |
On each of the last three releases the 2-year yield was slightly lower on the release day than the day before, but the moves were small and the reaction to any single release depends on what was already priced in — not just the PPI number, but the CPI print the day before and everything else the market is weighing. Our 2026 rate-cut cycle pillar covers how rate expectations are read. Past reactions do not predict the next one.
What do active traders watch on PPI morning?
Factually, the items market participants tend to focus on around the release:
1. The print versus consensus — for headline and core; the surprise, not the level, is what repricing keys off.
2. The goods/services and core detail — as in May, one component (energy) can drive the headline while core tells a steadier story.
3. The read alongside CPI — the prior day’s consumer-price print, since the two are read as a pair.
4. Index futures and rate-sensitive names in premarket — the first read on how expectations are shifting.
5. Volatility around the 9:30 a.m. ET open — the open following a surprise print often sees elevated volume and fast movement, conditions in which order type and risk controls matter.
Trading around scheduled economic data involves substantial risk: markets can move sharply and unpredictably in either direction, and premarket liquidity is limited. Most day traders lose money. Nothing here is a recommendation to trade any instrument or event.
Risks
Trading around a scheduled data release like PPI carries specific risks. The number is unknown until 8:30 a.m. ET, and prices can move sharply in either direction on the release and reverse just as fast as the market digests the detail. Because the reaction lands in premarket, liquidity is thinner and spreads are wider than in regular hours, so slippage and gap risk are elevated.
A surprise in either direction does not have a guaranteed market response; the reaction depends on what was already priced in, and on the CPI print the day before. The data describes past producer prices and does not predict the next release or any market. Most day traders lose money. Nothing on this page is a recommendation to trade any security, and nothing here forecasts any figure.
FAQ
What time is the PPI report released?
At 8:30 a.m. Eastern Time on the scheduled day, per the BLS — one hour before the regular U.S. equity session opens. The first reaction appears in index futures and premarket trading.
When is the next PPI report?
Wednesday, July 15, 2026, at 8:30 a.m. ET, covering June 2026 data — the morning after the June CPI report.
What is the difference between PPI and CPI?
PPI measures the prices producers receive for their output; CPI measures the prices consumers pay. PPI sits earlier in the supply chain, so it is often read as a “pipeline” reading of price pressure, while CPI reflects prices at the checkout. Markets watch both.
What did the last PPI report show?
May 2026 (released June 11, 2026): final demand rose 1.1% on the month and 6.5% over 12 months, the largest 12-month rise since November 2022; core (less foods, energy, and trade services) rose 0.8% and 5.1%. Most of the monthly increase came from energy, per the BLS.
Why are CPI and PPI watched together?
They measure the same question — inflation — from two vantage points, and this cycle they land on back-to-back mornings (CPI July 14, PPI July 15). Read as a pair, they can confirm or complicate each other’s signal.
Where can I read the official PPI release?
On the Bureau of Labor Statistics website: bls.gov/news.release/ppi.nr0.htm (release) and bls.gov/schedule/news_release/ppi.htm (schedule).
Disclosures: Trading involves substantial risk and is not suitable for every investor. Trading around scheduled data releases can be especially volatile, and premarket liquidity is limited. Capital is at risk and most day traders lose money. Leverage, where offered, amplifies both gains and losses, and you can lose more than you deposit. Client accounts are not SIPC or FSCS insured. This content is provided for information and education only. It is not investment advice or a recommendation of any security, and it does not predict the PPI, the CPI, interest rates, or any market. PPI figures are from the U.S. Bureau of Labor Statistics; interest-rate figures are from FRED, as dated above. See our full disclosures and policies.
[1] U.S. Bureau of Labor Statistics, Producer Price Indexes — May 2026 (USDL-26-0826), released June 11, 2026: bls.gov/news.release/ppi.nr0.htm.
<!– CMS: NewsArticle schema — headline, datePublished, dateModified (update each release), publisher=CMEG, about=”Producer Price Index (PPI)”. FAQPage schema on the FAQ block. Internal links to wire at publish: “CPI report hub” → CPI Report hub; “2026 rate-cut cycle pillar” → Rate-Cut Cycle pillar; /faqs/; disclosures → /policies/. –>
<!– PUBLISH-DAY REFRESH BOX (5 min):
1. On/after July 15, 2026 (June PPI release), swap the “last report” section and the 13-month trend table to the June data from bls.gov/news.release/ppi.nr0.htm (Table A: SA monthly + NSA 12-month). Update the direct answer, the “as of” stamp, and the schedule table (drop June, it becomes the last print).
2. Add the June-11 (May-data) row’s outcome context only as FACTS; do NOT forecast June.
3. Refresh the DGS2 rate-reaction table with the newest release day (add the July 15 row) from FRED DGS2.
4. Re-confirm the remaining schedule dates against bls.gov/schedule/news_release/ppi.htm.
–>