

The US Census Bureau releases the Advance Monthly Retail Trade Report at 8:30 a.m. Eastern, roughly mid-month, covering the previous month. The next release is September 16, 2026, for August data, and it lands the same day as a scheduled Federal Reserve decision. The report is an estimate from a survey sample and is published with sampling errors.
Data as of August 19, 2026. Figures are historical and are not a forecast.
What time is the retail sales report released?
8:30 a.m. Eastern Time, on a date published in advance by the Census Bureau.
The report is formally the Advance Monthly Retail Trade Report, and it covers retail and food services sales for the month before the one in which it is published. The word “advance” is doing work in that title, and the section below explains what it means.
| Release date | Data month | Notes |
| September 16, 2026 | August 2026 | Same day as a scheduled Federal Reserve decision |
| October 15, 2026 | September 2026 | – |
| November 17, 2026 | October 2026 | – |
| December 16, 2026 | November 2026 | – |
The release is stated on the Census Bureau’s own calendar and in the previous month’s report, which names the next release date on its face.[^1]
What did the most recent report show?
Retail and food services sales of $763.6 billion for July 2026, down 0.6 percent from the previous month and up 5.0 percent from July 2025.[^1]
The Census Bureau’s exact wording is worth quoting, because the parentheses in it are the part most coverage removes:
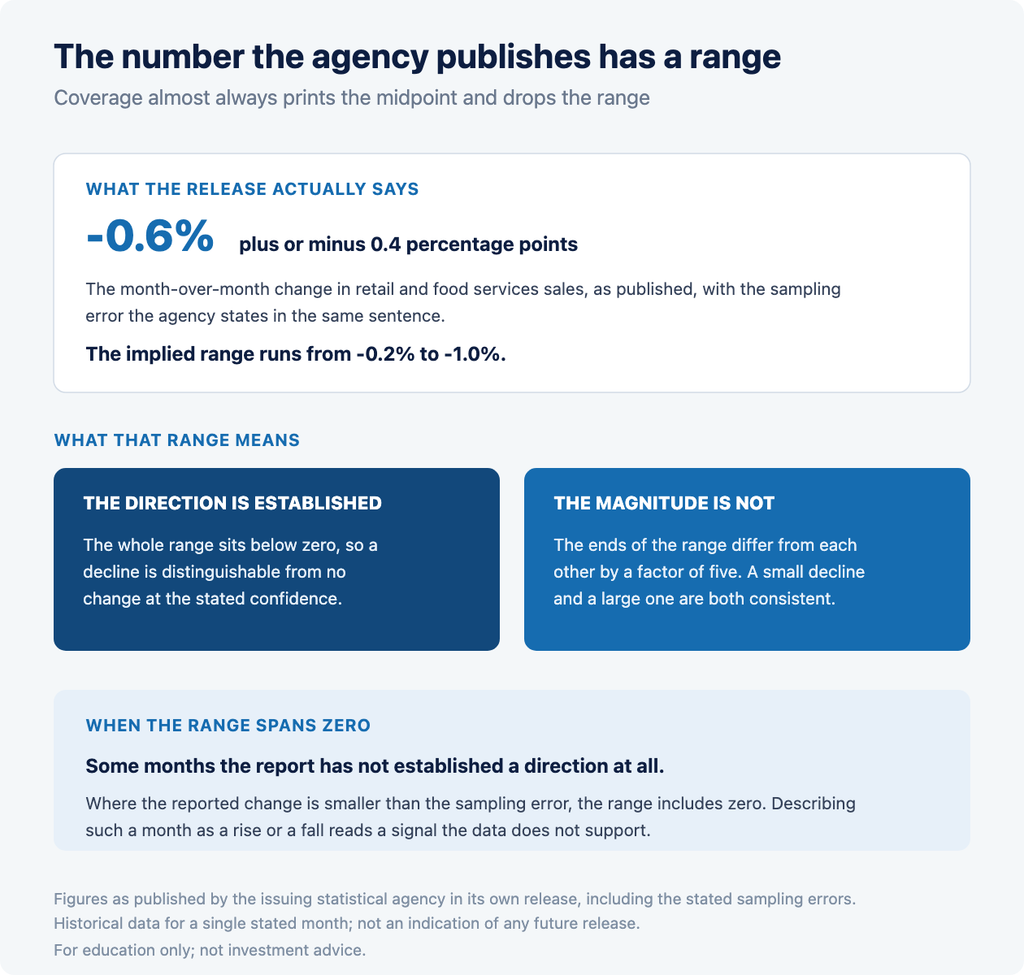
> “retail and food services sales for July 2026, adjusted for seasonal variation and holiday and trading-day differences, but not for price changes, were $763.6 billion, down 0.6 percent (±0.4 percent) from the previous month, but up 5.0 percent (±0.5 percent) from July 2025.”[^1]
Excluding motor vehicle and parts dealers, sales were down 0.3 percent on the month and up 5.8 percent on the year.[^1]
Two things that sentence tells you which a headline does not
The figures are adjusted for seasonality but not for prices. A change in the reported total combines a change in how much was bought with a change in what it cost. The report does not separate them, so a rise in the total is not by itself evidence that more goods were sold.
Every figure carries a sampling error. That is what the plus-or-minus is, and it is published by the agency rather than added by anyone else.
It is worth pausing on how unusual that is. Most economic figures a reader encounters are quoted as single numbers. The Census Bureau states its uncertainty on the face of the release, in the same sentence as the estimate, and the fact that the uncertainty is routinely stripped out downstream is a choice made by whoever republished it rather than a property of the data.
Why does the retail sales report have error bars?
Because it is an estimate from a survey sample, not a count of every transaction in the economy.
Each month the Census Bureau mails letters to a probability sample of approximately 4,800 employer firms, selected from the larger Monthly Retail Trade Survey.[^1] The published figure is an estimate produced from those responses, and the plus-or-minus expresses how much the estimate could differ from what a complete count would have shown.
| Measure | Published figure | Stated sampling error | Implied range |
| Month-over-month change | -0.6% | ±0.4% | -0.2% to -1.0% |
| Year-over-year change | +5.0% | ±0.5% | +4.5% to +5.5% |
Read the first row carefully. The whole implied range lies below zero, so a decline is distinguishable from no change at the stated confidence. But the range runs from a small decline to one nearly five times larger. The direction is established. The magnitude is not.
That distinction is almost universally dropped in coverage, which reports “retail sales fell 0.6 percent” as though it were a measured quantity rather than a central estimate. A reader who carries the error bars forward will interpret a small monthly move very differently from one who does not.
When a monthly change is not distinguishable from zero
In months where the reported change is smaller than the sampling error, the implied range spans zero. In that situation the report has not established that sales rose or fell at all, and describing such a month as an increase or a decrease is reading a signal the data does not support.
This happens regularly, because monthly changes are frequently smaller than half a percent. Table 4 below shows several such months in the past year.
The point is not that those releases were uninformative. A figure with a range spanning zero still narrows what is plausible, and it still contributes to a longer series where individual months’ errors partly offset one another. The point is narrower: a single month’s headline should not be read as a measured fact about the direction of the economy when the agency publishing it has said the direction is inside the noise.
What does “advance” mean, and how much do the figures get revised?
It means the estimate is built from a smaller sample and is superseded by fuller ones.
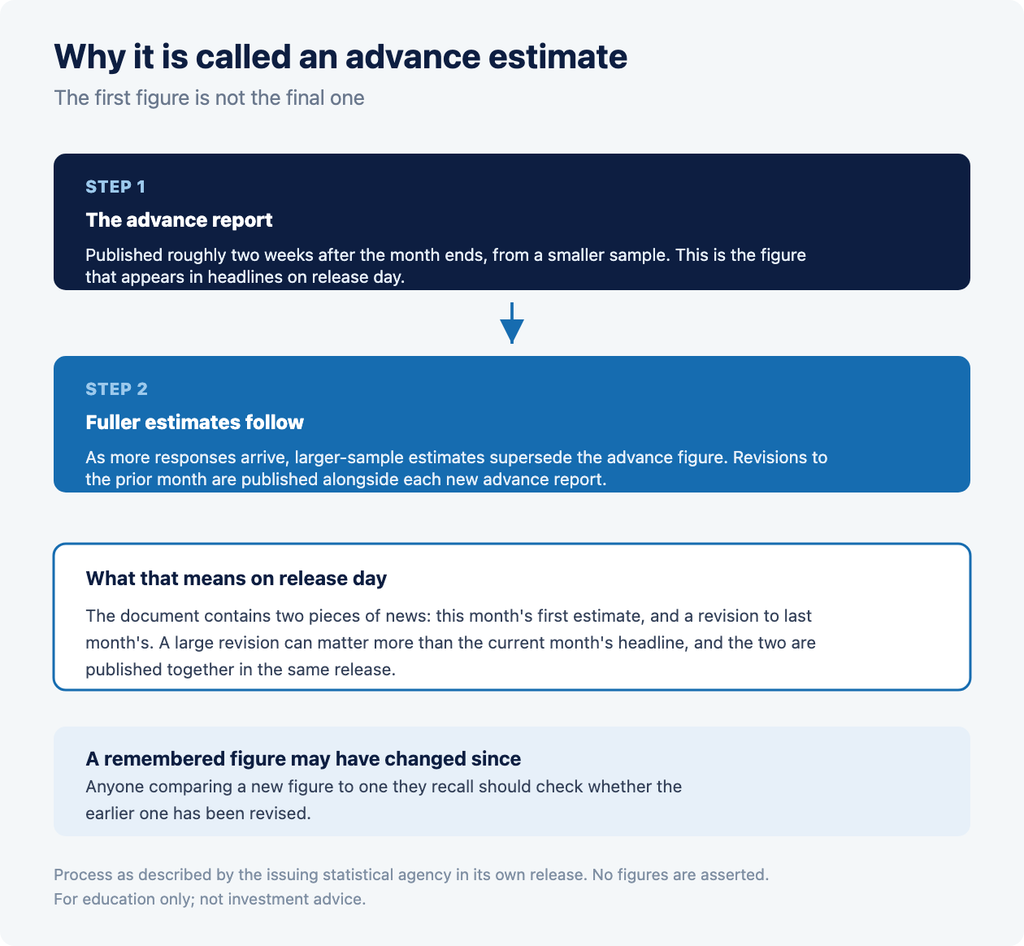
The advance report is the first estimate of a month’s retail sales, published roughly two weeks after the month ends. It is followed by fuller estimates based on a larger sample as more responses arrive. A figure quoted from an advance report is therefore a first read, not a final one.
The practical consequence is that a number widely reported on release day can be revised afterwards, and revisions to the prior month are published alongside each new advance report. Anyone comparing a current figure to a remembered one should check whether the remembered one has since been revised.
What is seasonal adjustment, and why does it matter here?
It is a statistical correction for the fact that retail sales follow a strong and predictable annual pattern, and without it a monthly series would be almost unreadable.
Retail sales are far higher in December than in January for reasons that have nothing to do with the state of the economy. If the published series were unadjusted, every December would show a large rise and every January a large fall, and those swings would drown any change worth noticing.
The Census Bureau therefore publishes the headline figures “adjusted for seasonal variation and holiday and trading-day differences.”[^1] Three separate corrections sit inside that phrase.
Seasonal variation is the recurring annual pattern itself.
Holiday differences account for holidays that move between months or fall on different weekdays from year to year.
Trading-day differences account for the fact that months contain different numbers of each weekday. A month with five Saturdays is not comparable to one with four, because retail activity is not spread evenly across the week.
What seasonal adjustment does not do
It does not remove uncertainty, and it does not adjust for prices. It also introduces a modelling choice: the adjustment is produced by a statistical procedure with assumptions, and those assumptions are revised periodically, which is one reason historical figures can change even for months long past.
The practical consequence for a reader is that a seasonally adjusted monthly change is a processed number, not a raw observation. That is not a criticism. It is what makes month-to-month comparison possible at all, and it is worth knowing that the processing exists.
What does the report actually break down?
Sales by kind of business, classified under the North American Industry Classification System.[^1]
The headline total is an aggregate of those categories, and they do not move together. Motor vehicle and parts dealers are large enough that their movement alone can determine the direction of the total, which is precisely why the Census Bureau publishes a figure excluding them.
| Aggregate | Change on the month | Change on the year |
| Retail and food services, total | -0.6% | +5.0% |
| Total excluding motor vehicle and parts | -0.3% | +5.8% |
In that month the two aggregates pointed the same way but by different amounts, and the year-over-year figures differ in the opposite direction from the monthly ones. Neither aggregate is the correct one; they answer different questions, and which is more useful depends on what a reader is trying to establish.
Why the excluding-vehicles figure exists
A vehicle is an expensive, infrequent purchase. A small change in the number sold moves a large dollar total, and those changes are often driven by supply, financing terms or incentive programmes rather than by broad consumer conditions.
Removing the category does not make the remaining figure more accurate. It makes it less dominated by one lumpy component, which is a different property and sometimes the more useful one.
How have retail sales trended?
The table below records the reported monthly level over the past thirteen months.
| Month | Level ($m) | Change on the month |
| July 2025 | 727,176 | – |
| August 2025 | 731,700 | +0.62% |
| September 2025 | 732,192 | +0.07% |
| October 2025 | 731,051 | -0.16% |
| November 2025 | 734,718 | +0.50% |
| December 2025 | 734,717 | 0.00% |
| January 2026 | 734,503 | -0.03% |
| February 2026 | 741,278 | +0.92% |
| March 2026 | 754,013 | +1.72% |
| April 2026 | 759,097 | +0.67% |
| May 2026 | 766,192 | +0.93% |
| June 2026 | 768,072 | +0.25% |
| July 2026 | 763,602 | -0.58% |
The FRED level for July 2026 is $763,602 million, which corresponds to the Census Bureau’s published $763.6 billion, and the computed monthly change of -0.58 percent corresponds to the published -0.6 percent. Two independent sources carrying the same figure is a useful check, and it is the kind of check worth running before relying on any number.
Reading the column, not the story
Six of the twelve monthly changes shown are below half a percent in absolute terms, which is at or near the size of the sampling error. Those months carry less information than their printed values suggest.
⚠️ A caution about a similar-sounding series. FRED also publishes a series called Retail Trade, which excludes food services. It is not the same as the Census Bureau’s “excluding motor vehicle and parts” figure, and the two produce different numbers for the same month. Anyone pulling this data should check which series they have.
Why does September 16 carry two scheduled events?
Because the retail sales release and a Federal Reserve decision fall on the same date.
The Census Bureau releases August retail sales at 8:30 a.m. Eastern. The Federal Open Market Committee concludes a two-day meeting the same day, and that meeting is one of the four in the year that carries a Summary of Economic Projections and a press conference.
| Date | Time (ET) | Event | Issuer |
| September 15-16 | – | FOMC meeting, with projections and press conference | Federal Reserve |
| September 16 | 8:30 a.m. | Advance Monthly Retail Trade Report, August | Census Bureau |
| September 16 | 8:30 a.m. | Import and Export Price Indexes, August | Bureau of Labor Statistics |
Sessions containing more than one scheduled release are not unusual. The observation here is simply that the published calendars show both on the same day, which is a fact a reader building a calendar needs and which is easy to miss.
Where does retail sales sit among the other monthly indicators?
It is one of several scheduled monthly releases, each measuring something different and each published by a different agency.
| Report | Measures | Agency |
| Employment Situation | Payroll employment and unemployment | Bureau of Labor Statistics |
| Consumer Price Index | Prices paid by consumers | Bureau of Labor Statistics |
| Producer Price Index | Prices received by producers | Bureau of Labor Statistics |
| Advance Monthly Retail Trade | Retail and food services sales, in dollars | Census Bureau |
| Personal Income and Outlays | Income, spending and the PCE price index | Bureau of Economic Analysis |
The distinction that matters most for reading retail sales is that it is measured in dollars and not adjusted for prices, whereas the price indexes measure prices directly. The two answer different questions, and a change in one does not translate into a statement about the other.
How does the market commonly read the retail sales morning?
By comparing the released figure to whatever estimate was circulating, and by looking at the revision to the prior month at the same time.
Two features of the release are worth knowing before the morning rather than during it.
The prior month is revised in the same document.
A release can carry a figure close to expectations for the current month alongside a meaningful revision to the previous one, and the two are published together.
The composition matters as much as the total. The report breaks sales down by kind of business, and the headline is an aggregate of categories that can move in opposite directions. The excluding-motor-vehicles figure exists because vehicle sales are large, lumpy and capable of moving the total on their own.
The mechanics of an 8:30 release
A scheduled release arriving at a fixed, published instant behaves differently from information that emerges gradually, and the difference concerns execution rather than direction.
Quoted spreads can widen around the release. Liquidity providers face greater uncertainty about the next price immediately before and after a fixed-instant print, and quoted spreads have historically reflected that.
Prices can move discontinuously. When information arrives at a known instant, the next traded price need not sit adjacent to the last. An 8:30 a.m. release lands an hour before the regular US equity session opens, so for equities the adjustment appears in pre-market trading and then in the opening price rather than as a mid-session move.
Orders can fill away from the last quote.
A market order submitted into a fast-moving book executes against whatever liquidity is present, not at the price displayed a moment earlier. A stop order, which becomes a market order once triggered, carries the same exposure.
Our article on pre-market movers covers the gapping mechanic in more detail. None of these consequences says anything about which way any instrument moves; they concern the cost and the certainty of transacting.
How does retail sales relate to the wider measure of consumer spending?
It is one input among several, and it covers a narrower slice of activity than the phrase “consumer spending” usually implies.
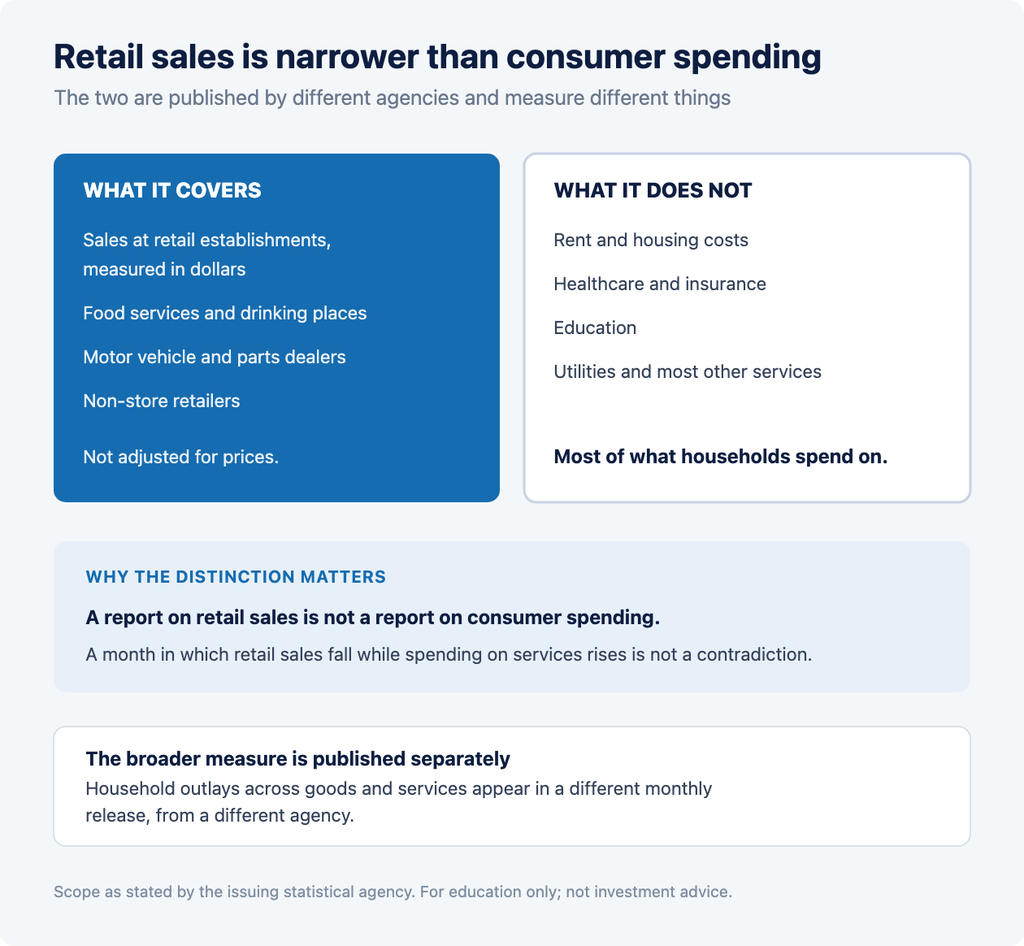
Retail sales measure sales at retail and food services establishments, in dollars. A great deal of what households spend money on falls outside that: rent and housing costs, healthcare, insurance, education, utilities, transport services and most other services are not retail establishments and do not appear.
The broader measure of household outlays is published separately by the Bureau of Economic Analysis, in the Personal Income and Outlays report, which carries the personal consumption expenditures figures and the PCE price index. That report covers goods and services together and is published monthly on its own schedule.
| Included | Not included |
| Sales at retail establishments, in dollars | Rent and housing costs |
| Food services and drinking places | Healthcare and insurance |
| Motor vehicle and parts dealers | Education |
| Non-store retailers | Utilities and most other services |
Why the distinction matters when reading coverage
A report on retail sales is sometimes described as a report on “the consumer” or on “consumer spending”. Those phrases cover considerably more ground than the release does. A month in which retail sales fall while spending on services rises is not a contradiction; the two measure different things and are published by different agencies.
The narrower reading is also the more defensible one: the release states what it measured, in dollars, at a defined set of establishments, with a stated sampling error.
What should a reader check first on release day?
Four things, in an order that takes a couple of minutes.
The headline change and its sampling error together. If the change is smaller than the error, the release has not established a direction.
The revision to the prior month. It is published in the same document, and a substantial revision can matter more than the current month’s figure.
The excluding-motor-vehicles figure. If it points differently from the headline, one lumpy category is driving the total.
Which month the figure covers. A release in mid-September reports August. Coverage sometimes elides this, and a reader can end up attributing a figure to the wrong month, which matters most when comparing the release to something that happened in between.
Each of those is available in the release itself, free, at the moment it is published, before any commentary appears.
Risks and limitations
This is an estimate from a sample. Every figure carries a sampling error published alongside it, and the error is frequently comparable in size to the monthly change itself, which is the single most important limitation on this page.
The advance figure is revised. It is the first estimate, based on a smaller sample than the fuller reports that follow.
Not adjusted for prices. A change in reported dollar sales combines volume and price, and the report does not separate them. In a period of rising prices, dollar sales can increase while the quantity of goods sold does not, and the release itself offers no way to distinguish the two.
Dates can change. Release dates are published in advance by the Census Bureau and should be confirmed against its calendar before being relied upon. The Census calendar also carries a status marker for releases that have been suspended or rescheduled, which is worth checking rather than assuming a listed date is live.
Historical data describes the past only. Table 4 records thirteen months and carries no information about any future release.
Series are easily confused. As noted above, a similarly named series measuring retail trade excluding food services is not the same thing as retail sales excluding motor vehicles, and the two return different numbers for the same month.
Trading involves risk of loss. Volatility around a scheduled release can widen spreads and produce gaps between sessions. The effect is amplified in a margin account, where leverage increases both gains and losses relative to the capital committed. Margin requirements and account minimums are set out in the relevant account documentation.
Nothing here is investment advice. This article reports published data and scheduled dates. It makes no recommendation about any security and no forecast of any release.
Frequently asked questions
What time does the retail sales report come out?
The US Census Bureau releases the Advance Monthly Retail Trade Report at 8:30 a.m. Eastern Time, roughly mid-month, covering the previous month. The next scheduled release is September 16, 2026, for August data. Dates are published on the Census Bureau’s economic indicator calendar.
What did the last retail sales report show?
Retail and food services sales for July 2026 were $763.6 billion, down 0.6 percent from the previous month with a stated sampling error of 0.4 percent, and up 5.0 percent from July 2025. Excluding motor vehicle and parts dealers, sales fell 0.3 percent.
Why does the retail sales report have a plus or minus figure?
Because it is an estimate from a probability sample of approximately 4,800 employer firms rather than a count of every transaction. The plus-or-minus is the sampling error, expressing how far the published estimate could sit from what a complete count would have shown.
What does advance mean in the retail sales report?
It means this is the first estimate for the month, produced from a smaller sample and published roughly two weeks after the month ends. Fuller estimates follow as more responses arrive, and revisions to the prior month appear alongside each new advance report.
Is the retail sales report adjusted for inflation?
No. The figures are adjusted for seasonal variation and for holiday and trading-day differences, but explicitly not for price changes. A change in the reported dollar total therefore combines a change in quantity bought with a change in what it cost.
Who publishes the retail sales report?
The US Census Bureau, which is part of the Department of Commerce. This is a different agency from the Bureau of Labor Statistics, which publishes the price indexes and the employment report, and from the Bureau of Economic Analysis, which publishes personal income and outlays.
Sources
[^1]: US Census Bureau, Advance Monthly Retail Trade Report for July 2026 (marts_current.pdf), retrieved August 19, 2026. Source for the $763.6 billion headline, the month-over-month change of -0.6 percent (±0.4 percent), the year-over-year change of +5.0 percent (±0.5 percent), the excluding-motor-vehicle figures of -0.3 percent and +5.8 percent, the description of the sample as approximately 4,800 employer firms drawn from the Monthly Retail Trade Survey, the seasonal-adjustment and price wording quoted in full, and the next release date of September 16, 2026. Release dates additionally cross-checked against the Census Bureau’s 2026 economic indicator calendar.
[^2]: Federal Reserve Bank of St. Louis, FRED series RSAFS (Advance Retail Sales: Retail and Food Services, Total), retrieved via the FRED API endpoint fred/series/observations on August 19, 2026. Source for Table 3. The FRED API requires a key and is therefore not publicly reproducible from a bare link; the underlying series is viewable without a key at fred.stlouisfed.org/series/RSAFS. API documentation: fred.stlouisfed.org/docs/api/fred/. Raw responses retained. Month-over-month percentages in Table 3 were computed from the retrieved series.
[^3]: Board of Governors of the Federal Reserve System, “FOMC Calendars, Statements, and Minutes,” federalreserve.gov/monetarypolicy/fomccalendars.htm. Retrieved August 19, 2026. Source for the September 15-16, 2026 meeting dates and for that meeting carrying a Summary of Economic Projections and a press conference.
This article is published by Capital Markets Elite Group (KY) Limited for informational and educational purposes only. It does not constitute investment advice, a recommendation, or an offer or solicitation to buy or sell any security or financial instrument. Trading involves risk, including the risk of loss. Past performance and historical data are not indicative of future results. Figures are stated as of the dates shown and may change. Readers should consider their own circumstances and consult a qualified professional where appropriate. See our full terms at /policies/.