

NVIDIA reports on a fiscal calendar offset from the calendar year, with quarters ending in late January, April, July and October. Its most recent scheduled report covered the quarter ended July 26, 2026, and the following report is scheduled for November 2026. Consensus figures move continuously and are published by data providers rather than by the company.
Data as of August 19, 2026. Figures are historical or previously published and are not a forecast. Confirm all dates against the company’s investor-relations site.
When does NVIDIA report earnings?
On a schedule set by its own fiscal calendar, which does not follow the calendar year.
The company announces each date individually, typically several weeks ahead. For the quarter ended July 26, 2026, NVIDIA announced on July 29, 2026 that it would hold its conference call on Wednesday, August 26, 2026.[^1] Its investor-relations events page listed that event at 2:00 p.m. Pacific Time, which is 5:00 p.m. Eastern.[^2]
| Report | Date | Session | Consensus EPS | Consensus revenue | Date status |
| Q2 FY2027 | August 26, 2026 | After the close | $2.13 | Approximately $93.6bn | Company-confirmed |
| Q3 FY2027 | November 17, 2026 | After the close | $2.41 | Approximately $105.7bn | Provider projection |
| Q4 FY2027 | February 23, 2027 | After the close | $2.74 | Approximately $119.4bn | Provider projection |
| Q1 FY2028 | May 18, 2027 | Not stated | $2.95 | Approximately $129.4bn | Provider projection |
Only the first row is a company statement. The remaining dates are a data provider’s inference from NVIDIA’s past reporting pattern. They are useful for planning and they are not facts until the company announces. Each is superseded the moment NVIDIA sets the date itself.
A note on the consensus column
The revenue and earnings figures in Table 1 are estimates published by one named data provider, and they are revised continuously. The figures for the later quarters in particular will change many times before those quarters arrive. They are shown to indicate what benchmark each report will initially be measured against, not as a projection of any outcome.
How much notice does the company give?
For the August 2026 report, NVIDIA announced the date on July 29, 2026, roughly four weeks ahead.[^1] That is a single data point rather than a rule, but it indicates the order of magnitude of notice a reader can expect, and it means a projected date for a quarter several months out is likely to be confirmed or corrected well before the quarter itself arrives.
The practical implication is that there is little reason to rely on a projected date for a distant quarter. By the time the quarter approaches, the company will normally have said.
Why is a report in August covering a “second quarter”?
Because NVIDIA’s fiscal year is offset from the calendar year by about a month.
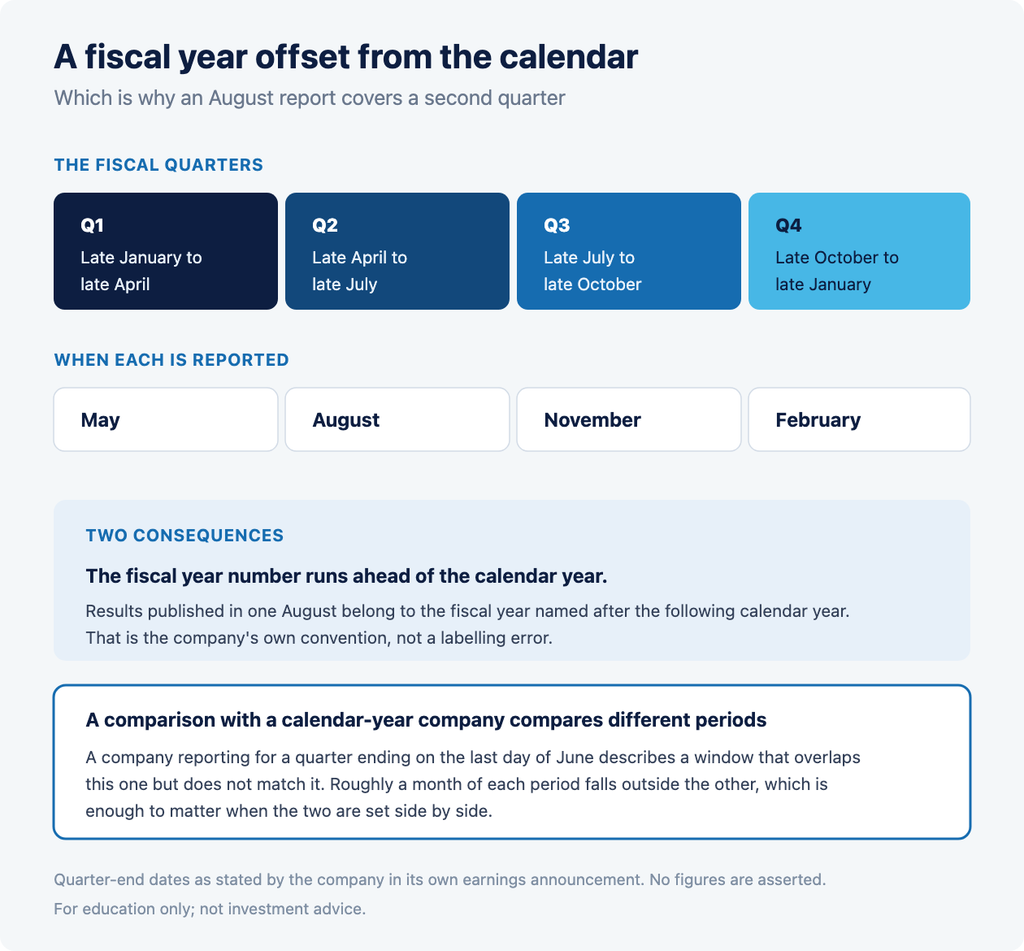
The company’s fiscal quarters end in late January, late April, late July and late October. The quarter discussed on the August 2026 call ended on July 26, 2026.[^1] That places it in the company’s fiscal 2027, which began in late January 2026.
| Fiscal quarter | Approximate period covered | Reported |
| Q1 | Late January to late April | May |
| Q2 | Late April to late July | August |
| Q3 | Late July to late October | November |
| Q4 | Late October to late January | February |
Two consequences worth holding
A comparison with a calendar-year company is a comparison of different periods. A company reporting for the quarter ended June 30 is describing a window that overlaps NVIDIA’s but does not match it. Roughly a month of each period falls outside the other.
The fiscal year number runs ahead of the calendar. Results published in August 2026 belong to fiscal 2027. That is not an error in the label; it is the company’s own convention.
What is a consensus estimate, and why do sources differ?
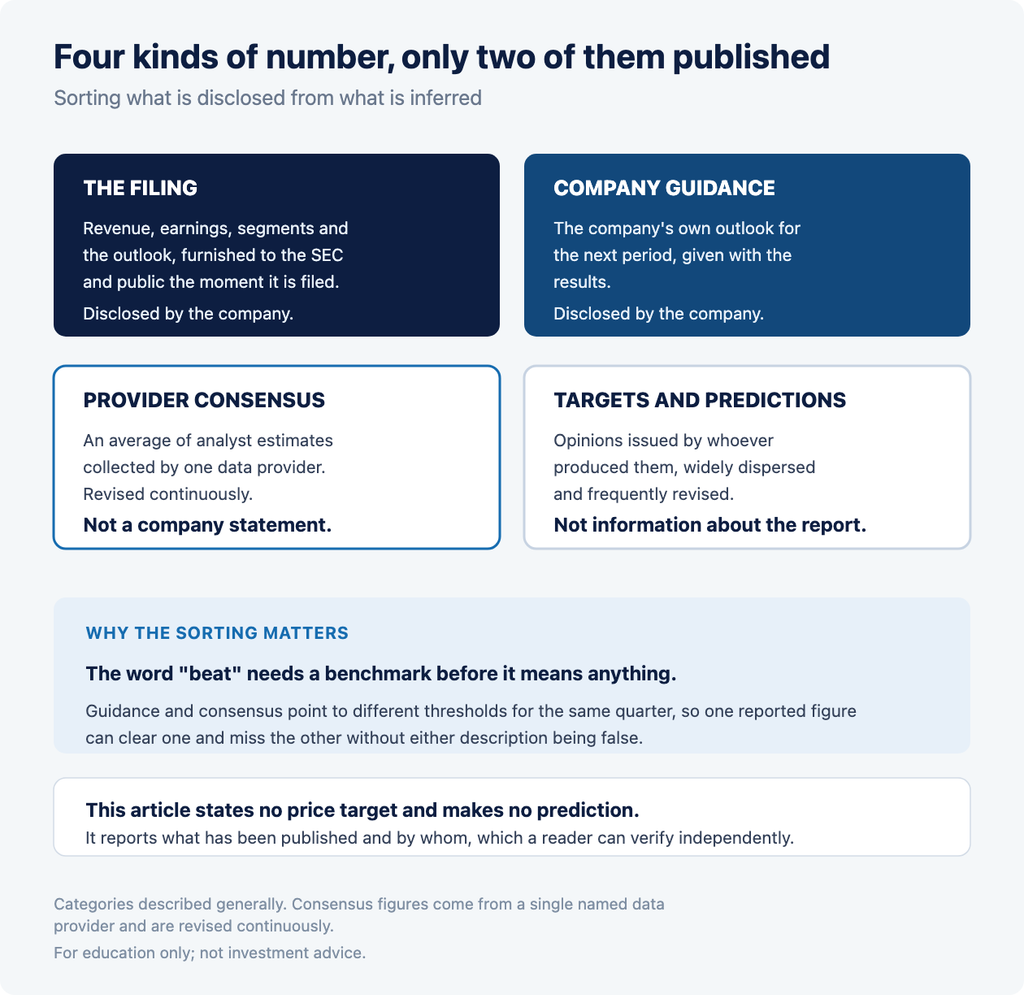
A consensus estimate is an average of individual forecasts that analysts have submitted to a data provider. It is not a company statement, not a filing, and not a single agreed number.
Providers collect from different analyst panels, apply different rules about how stale a submission may be before it is dropped, and treat adjusted and reported earnings differently. Two providers publishing a consensus for the same company in the same week can print different figures, and neither is wrong.
This article names Finnhub as its provider throughout.[^3] Another provider may publish different numbers. Where a comparison is drawn, it is drawn within one provider’s figures rather than across two.
Company guidance is a separate quantity again
Alongside its reported results, NVIDIA publishes its own outlook for the following quarter. That outlook and any provider’s consensus are produced by different people, for different purposes, on different information, and they need not agree.
The practical consequence is that a single reported figure can be described as beating one benchmark and missing another, in the same sentence, without either description being false. Which benchmark a commentator selects changes the headline without changing the number. Anyone reading coverage of a report should establish which benchmark is in use before drawing a conclusion from the word “beat”.
How has NVIDIA performed against provider estimates?
Consistently above them, by consistently small margins.
| Fiscal quarter | Period ending | Reported | Estimate | Difference |
| Q1 FY2027 | June 30, 2026 | $1.87 | $1.79 | +4.34% |
| Q4 FY2026 | March 31, 2026 | $1.62 | $1.56 | +3.62% |
| Q3 FY2026 | December 31, 2025 | $1.30 | $1.27 | +1.99% |
| Q2 FY2026 | September 30, 2025 | $1.05 | $1.03 | +2.13% |
Every one of the four came in above the provider’s estimate, and every difference was under five percent.
Three observations belong with that table, and they cut in different directions.
A small consistent difference suggests the business is modelled closely. Where reported figures land within a few percent of estimates repeatedly, it indicates that analysts have a reasonably accurate model of the company. That is a statement about the estimating process, not about the results.
Consistency in the past is not a mechanism. Four quarters is a short record, and a run of results above estimate does not create any tendency for the next one to be. Each quarter is determined by what happened in it.
The size of the difference matters as much as its direction. A result two percent above an estimate is a materially different event from one twenty percent above it, and coverage that reports both simply as “a beat” discards that distinction.
Why a very large company tends to produce small differences
There is a structural reason a company of this scale is modelled closely, and it is worth understanding rather than treating the pattern as a company characteristic.
Widely held large companies attract more analyst coverage than smaller ones. More analysts submitting estimates means the average incorporates more information, and averaging across a larger panel tends to reduce the spread of the result around it.
Large companies also tend to give more detailed outlooks, and an outlook narrows the range analysts are working within. Where a company publishes its own expectation for the coming quarter, estimates cluster around it.
Neither of those makes a company more predictable in any deeper sense. They describe why the estimates tend to land close, which is a property of the estimating process rather than of the business.
How should a reader treat price targets and predictions?
As opinions belonging to whoever issued them, and as a separate category from anything in this article.
Search interest around a widely followed company generates a large volume of published price targets, share-price predictions and “will it beat” commentary. Three points are worth stating plainly about that material.
A price target is an opinion, not a disclosure. It is produced by an analyst or a commentator, reflects their own model and assumptions, and carries no company endorsement. It is not comparable to a revenue figure in a filing.
Targets are widely dispersed and frequently revised. Different analysts covering the same company at the same time publish materially different targets, and individual targets change as estimates change. A single quoted target describes one view at one moment.
A prediction about a report is not information about the report. Ahead of any scheduled release, what is actually known is the date, the estimates published by providers, the company’s own outlook if given, and the historical record. Anything beyond that is inference.
The volume of prediction is not a signal. A heavily covered company generates a great deal of forward-looking commentary simply because many outlets write about it. The quantity reflects the level of attention, not the quality of the information, and a claim repeated across many articles is not thereby better supported than one made once.
This article states no price target and makes no prediction, about this company or any other. It reports what has been published and by whom, which is a different kind of statement and one a reader can verify.
What is an expected move, and what is IV crush?
Ahead of a scheduled report, the options market prices a range rather than a direction.
Options expiring shortly after the report imply a magnitude of movement that market participants are collectively positioned for. That implied figure is a range, not a forecast of direction. It says nothing about which way an instrument moves, only about how far participants are collectively positioned for it to move.
After the report, the uncertainty those options were pricing resolves. Implied volatility in the contracts typically falls, a decline commonly described as IV crush. It is a mechanical consequence of a scheduled unknown becoming known, and it occurs whether the reported numbers were higher or lower than any estimate.
Our article on how earnings move stocks covers expected moves, IV crush and overnight gaps in full.
Why an after-the-close report gaps
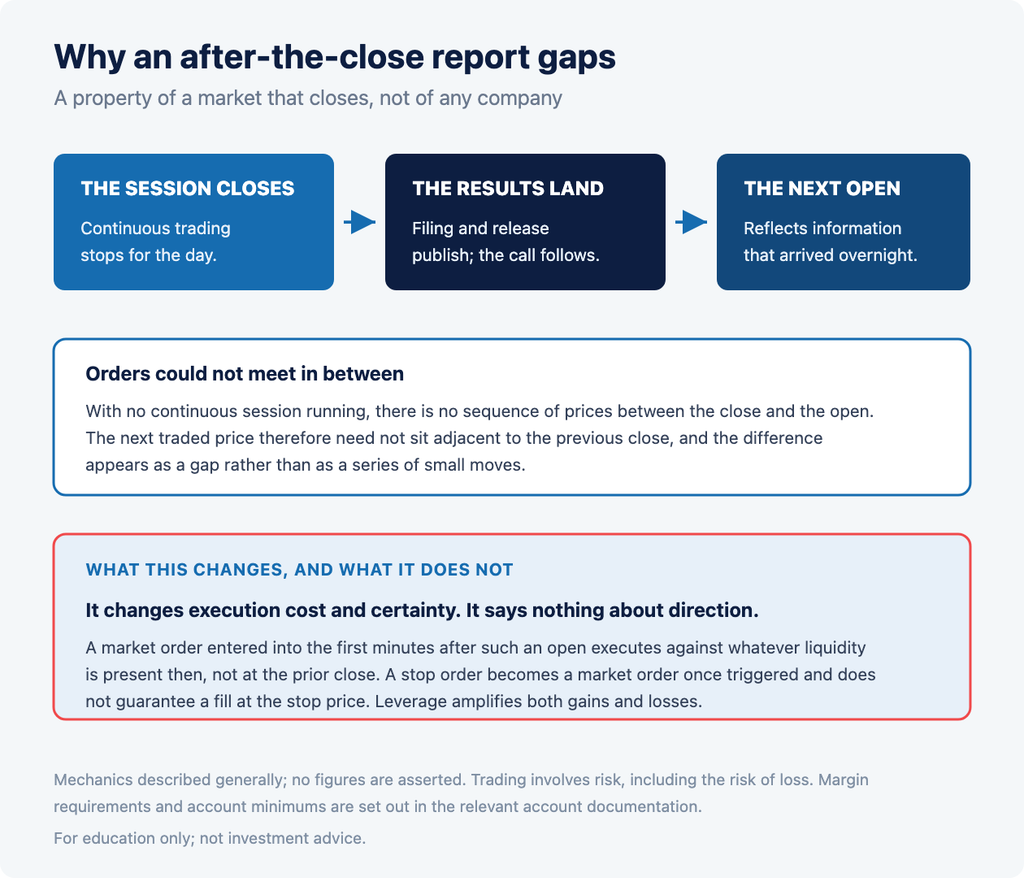
NVIDIA reports after the close. The information therefore arrives while the regular session is shut, and orders cannot meet at a continuous sequence of prices in that interval because no continuous session is running.
When regular trading resumes the following morning, the opening price reflects information that arrived overnight and need not sit adjacent to the previous close. This is the same mechanic described in our article on pre-market movers, and it is a property of a market that closes rather than of any particular company.
What this means for order handling
Two consequences follow, and both concern execution rather than direction. A market order entered into the first minutes after such an open executes against whatever liquidity is present at that moment, not at the closing price of the prior session. A stop order, which becomes a market order once triggered, carries the same exposure and does not guarantee a fill at the stop price.
The effect is amplified in a margin account, where leverage increases both gains and losses relative to the capital committed.
What is published on results day, and in what order?
The same sequence each quarter.
A filing. Results are furnished to the US Securities and Exchange Commission on Form 8-K, with the results release attached as an exhibit. That exhibit contains the revenue and earnings figures, the segment information and the outlook, and it is public on SEC EDGAR the moment it is filed.
The release, published simultaneously on the company’s news and investor-relations sites, carrying the same content.
The conference call, at the time the company announces. Management discusses the quarter and, in the ordinary course, addresses the outlook for the following one.
Why the order matters
The numbers are public before the call begins. A reader who waits for coverage is reading someone else’s summary of a document that was already available to them. The filing and the release are the primary record; everything published in the following hours is commentary on it.
The outlook given on the call is frequently the part of the event that draws the most attention, because it concerns a period that has not yet been reported.
What does the reported revenue trajectory in the estimates show?
That the provider expects each successive quarter to be larger than the last. It is important to be precise about what that is and is not.
| Fiscal quarter | Consensus revenue estimate | Consensus EPS estimate |
| Q2 FY2027 | Approximately $93.6bn | $2.13 |
| Q3 FY2027 | Approximately $105.7bn | $2.41 |
| Q4 FY2027 | Approximately $119.4bn | $2.74 |
| Q1 FY2028 | Approximately $129.4bn | $2.95 |
This is a record of what analysts currently expect, not a forecast by this firm and not a company statement. Three cautions apply and none of them is boilerplate.
Estimates for distant quarters are the least reliable figures on this page. An estimate for a quarter that ends more than a year away is built on assumptions that will be revised repeatedly. The further out the quarter, the wider the range of individual estimates behind the average and the more the average has historically moved before the quarter arrived.
A rising series of estimates is not evidence about outcomes. It records that analysts, at one moment, expected growth. Whether that expectation is met is determined by what happens, and estimates are revised downwards as often as upwards when circumstances change.
Do not read the table as a trend line. It is four separate estimates for four separate quarters, published at the same moment, each with its own uncertainty. Connecting them into a curve would imply a smoothness the underlying figures do not carry.
Why does a beat not guarantee a higher share price?
Because the reported quarter is one component of a release, and because the market’s positioning going in already reflects an expectation.
Guidance can matter more than the quarter. A release contains both the period just ended and the outlook for the next one. A result above an estimate alongside an outlook below expectations is a common combination.
The benchmark is contested. Company guidance and provider consensus point to different thresholds for the same quarter, so “beat” is not a single well-defined event.
What was already priced in. If participants were positioned for a result comfortably above consensus, a result modestly above it is not the same event. The reference point is the expectation, not the printed estimate.
Magnitude is not direction. As Table 3 shows, a result can be above an estimate by a small margin repeatedly. Whether that is received as significant depends on what was expected, which is not published anywhere.
None of this predicts how any report will be received. It explains why the relationship between a reported number and a share price is not mechanical, which is a different claim.
How does the market commonly read a report of this kind?
By separating what was published from what is inferred from it.
The published components a reader can check directly are the revenue figure, the earnings figure, the segment information, and the outlook for the following period. Each is a number the company published and stood behind, available in the filing before any commentary appears.
Everything after that is interpretation. Which benchmark a commentator uses, how much weight they place on the outlook against the reported quarter, and what they infer about other companies or about an industry are all choices, and different commentators make them differently.
On read-through to other companies
Results from companies in a related supply chain are sometimes described as carrying a read-through to one another. That description deserves care. Companies in the same broad industry serve different customers, sell different products at different points in a supply chain, and report on different fiscal calendars.
One company’s result is information about that company. Whether it tells a reader anything about another is a judgement, not a fact, and it is not a judgement this article makes.
Risks and limitations
Only one date here is confirmed. Table 1’s status column marks which. The later dates are provider projections and should be re-checked against the company’s investor-relations site before being relied upon. As the notice period above indicates, the company normally announces well ahead of the quarter, so a projection for a distant quarter has usually been superseded by the time it matters.
Estimates move continuously. Consensus figures are revised as analysts update submissions, and most actively in the days before a report. The figures here are stamped to their retrieval date and will be stale afterwards. The estimates for quarters several months out will change many times.
Provider figures are not interchangeable. This article names one provider throughout. Another may publish different numbers for the same quarter, and a comparison drawn across two providers is not a like-for-like comparison.
Historical results describe the past only. Table 3 records four quarters and carries no information about any future one. Four observations is a short record by any standard, and it would be a short record even if the differences within it were larger than they are.
Company outlooks supersede the figures here. When the company publishes an outlook for a coming quarter, that outlook becomes a benchmark alongside the consensus and changes how the following report is assessed.
Trading involves risk of loss. Volatility around a scheduled report can widen spreads and produce gaps between sessions, and a position sized on the assumption of continuous pricing can behave differently. The effect is amplified in a margin account, where leverage increases both gains and losses relative to the capital committed. Margin requirements and account minimums are set out in the relevant account documentation.
Nothing here is investment advice. This article reports scheduled dates, published estimates and historical data. It makes no recommendation about any security, states no price target, and expresses no view on whether any result will be higher or lower than any estimate.
A note on comparisons with other companies
Coverage of a semiconductor result frequently compares one company against another, and a reader searching around this topic will encounter such comparisons constantly. This article does not make them.
The reason is partly factual. Companies described as peers often sell different products, to different customers, at different points in a supply chain, and report on different fiscal calendars. A comparison that ignores those differences compares labels rather than businesses.
The other reason is that a comparison of that kind is an opinion presented as analysis. Stating that one company’s results are better than another’s, or that one is preferable to another, is a judgement about relative merit. This article confines itself to what each company has published about itself, with the source named, and leaves the judgement to the reader.
Frequently asked questions
When is NVIDIA’s next earnings report?
NVIDIA announces each date individually. Its most recent confirmed report was for the quarter ended July 26, 2026, discussed on a call on August 26, 2026. A data provider projects the following report for November 2026, which is an estimate rather than a company statement.
What time does NVIDIA hold its earnings call?
NVIDIA’s investor-relations events page listed its second-quarter fiscal 2027 event at 2:00 p.m. Pacific Time, which is 5:00 p.m. Eastern. The company is headquartered in California. Times are set per report, so confirm the time for any specific quarter on the company’s investor-relations site.
Why does NVIDIA report a second quarter in August?
Because its fiscal year is offset from the calendar year by roughly a month. Its quarters end in late January, April, July and October, so the quarter ending in late July is its second fiscal quarter and is reported in August.
What is a consensus estimate?
An average of individual forecasts that analysts submit to a data provider. It is not published by the company and is not a filing. Different providers collect from different analyst panels, so two providers can publish different consensus figures for the same quarter.
Has NVIDIA beaten estimates recently?
Across the four most recent quarters the reported figure came in above the provider estimate each time, with every difference under five percent. A short record of small differences describes how closely the business has been modelled, and does not indicate anything about a future quarter.
Does NVIDIA report before the open or after the close?
After the close. Information arriving while the regular session is shut cannot be priced by orders meeting continuously, so the next opening price need not sit adjacent to the previous close. That affects the cost and certainty of execution rather than the direction of any instrument.
Sources
[^1]: NVIDIA Corporation, “NVIDIA Sets Conference Call for Second-Quarter Financial Results,” issued July 29, 2026, announcing a conference call on Wednesday, August 26, 2026 to discuss results for the second quarter of fiscal year 2027, for the quarter ended July 26, 2026. Retrieved August 19, 2026. Source for the confirmed date and the fiscal quarter-end date.
[^2]: NVIDIA Corporation, investor-relations events and presentations page, listing “NVIDIA 2nd Quarter FY27 Financial Results, August 26, 2026, 02:00 PM PT.” Retrieved August 19, 2026. Source for the call time. Note: syndicated copies of the press release render the time as “2 p.m. ET” with a stray bracket suggesting a truncated “2 p.m. PT (5 p.m. ET)” construction. The company’s own events page is used here in preference.
[^3]: Finnhub, endpoints /calendar/earnings and /stock/earnings for symbol NVDA, retrieved August 19, 2026. Source for the projected dates in Table 1, the consensus figures, and the four-quarter reported-versus-estimate history in Table 3. These endpoints require an API key and are not publicly reproducible from a bare link; the domain without a key returns an authentication error. API documentation: finnhub.io/docs/api. Raw responses retained.
This article is published by Capital Markets Elite Group (KY) Limited for informational and educational purposes only. It does not constitute investment advice, a recommendation, or an offer or solicitation to buy or sell any security or financial instrument. Trading involves risk, including the risk of loss. Past performance and historical data are not indicative of future results. Figures are stated as of the dates shown and may change. Readers should consider their own circumstances and consult a qualified professional where appropriate. See our full terms at /policies/.