
AMD (NASDAQ: AMD) will report its fiscal second-quarter 2026 results on Tuesday, August 4, 2026, after the market close, with a conference call at 5:00 p.m. ET, according to the company’s own announcement. [1] Published analyst estimates for the quarter sit at roughly $1.55 to $1.62 per share depending on the data provider, and AMD’s own revenue outlook for the quarter is approximately $11.2 billion, plus or minus $300 million. [2] [4]
Data on this page is current as of July 17, 2026. It is updated after each quarterly report. This content is for information and education only and is not investment advice.
When does AMD report earnings?
AMD announced on July 8, 2026 that it will report fiscal second-quarter 2026 financial results on Tuesday, August 4, 2026, after the market close, and that management will hold a conference call to discuss them at 5:00 p.m. ET / 2:00 p.m. PT. [1]
Take the date from the company
Third-party earnings calendars are secondary sources and they do not always agree with the issuer. At the time of writing, at least one widely used data provider listed AMD’s Q2 date as August 3, 2026, a day earlier than the company’s own announcement of August 4. [1] The issuer’s announcement is the authority; every date on this page traces to AMD’s own release and should be re-checked there before it is relied on.
After the close, so the market responds the next morning
Because the release lands after the 4:00 p.m. ET close, no regular-session trading happens on the numbers on the day they are published. [5] The first regular session in which the market can respond opens at 9:30 a.m. ET the following morning. Whatever repricing occurs between those two points happens in the after-hours and premarket sessions, where liquidity is thinner and spreads are typically wider than in regular hours. Our guide to how earnings move stocks covers expected moves, IV crush and the overnight gap that results.
What is actually released, and what the call adds
Two separate things arrive, and they are not simultaneous. The results are published after the close as a press release, which the company also files with the SEC. The conference call follows at 5:00 p.m. ET, in which management discusses the quarter and takes questions. [1]
The segment detail is in the release, not just the commentary
AMD reports revenue by segment, and that detail is in the release itself. Its Q1 2026 results separated Data Center revenue of $5.8 billion, up 57% year over year, from Client and Gaming revenue of $3.6 billion, up 23% year over year. [2] This matters for reading a print: a single headline revenue number can be composed very differently from one quarter to the next, and the release is where that composition is visible without waiting for anyone’s interpretation of it.
The outlook arrives in the same release
The company’s outlook for the current quarter is published alongside the closed quarter’s results rather than separately. AMD’s Q1 2026 release carried both the Q1 figures and its Q2 revenue and margin outlook. [2] Because they arrive together, coverage of a print is generally reacting to both at once, which is worth knowing when a headline attributes a move to “the results.”
AMD’s fiscal calendar does not match the calendar
A small precision that most previews skip, and it changes what “the quarter ending June” actually means.
The fiscal year does not end on December 31
AMD’s Form 10-K for fiscal year 2025 covers the year ended December 27, 2025, not December 31. [3] AMD runs a fiscal calendar whose periods close on a weekend rather than on a calendar month-end, so its fiscal quarters end on dates that shift year to year and rarely coincide exactly with the end of a calendar quarter.
Why it is worth knowing
Coverage routinely describes the upcoming report as covering “the quarter ending June 30.” The company’s own language is more careful: its announcement refers simply to the fiscal second quarter of 2026. [1] The difference is small in practice and it does not change the reported figures, but it is the sort of detail that separates a page reading the company’s own filings from a page reading other coverage. It also means a reader comparing AMD’s fiscal periods against a calendar-quarter dataset for another company is not comparing identical windows.
The report follows the quarter’s close by about five weeks
The fiscal second quarter closes at the end of June and the results are scheduled for August 4. [1] That gap is normal: the company has to close its books, have the figures reviewed, and prepare the release and the call. By the time the quarter is reported it has been over for more than a month, which is part of why the outlook frequently draws more attention than the closed quarter.
What are analysts expecting, and why do the numbers differ?
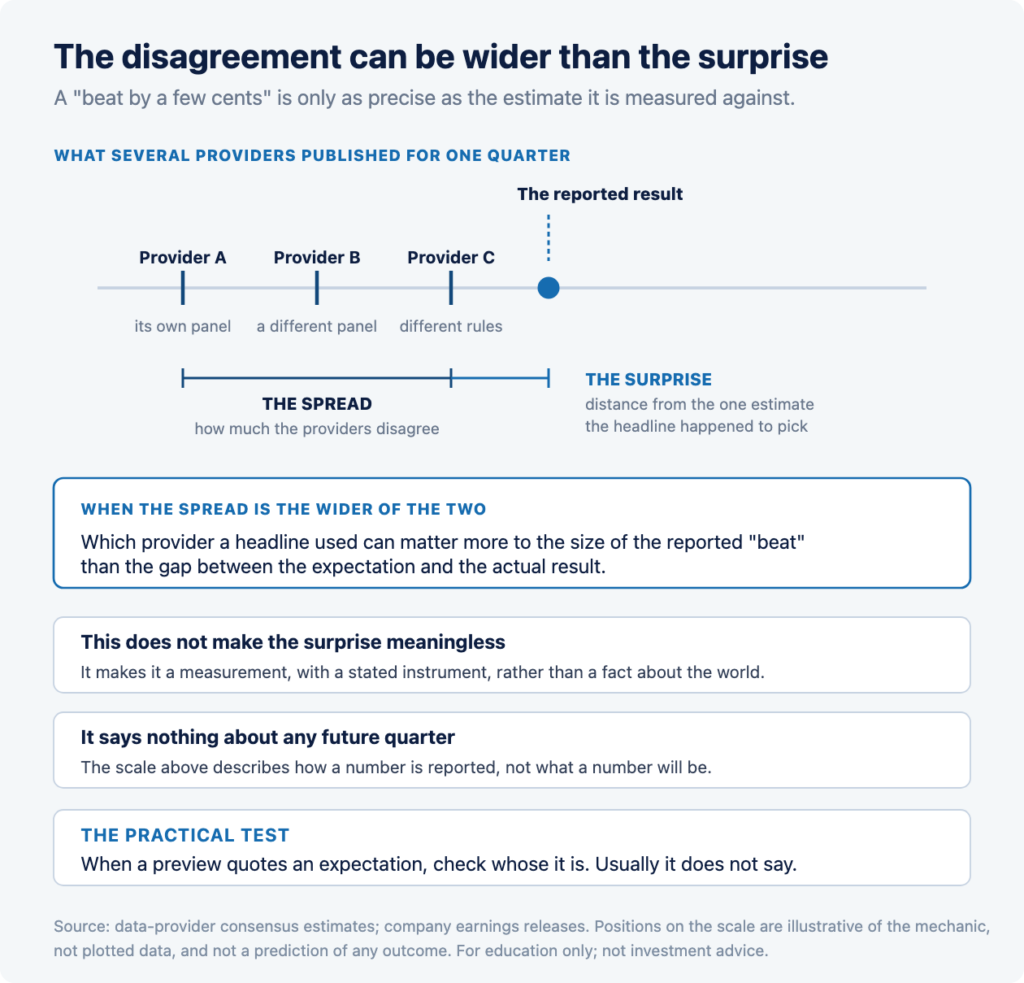
A consensus estimate is not an official figure. It is an average of forecasts from the analysts covering the company, assembled by a data provider. Providers survey different analyst panels and apply different rules, so several different “consensus” numbers exist for the same quarter at the same time.
The observed spread
For AMD’s second quarter of 2026, published estimates retrieved on July 17, 2026 ranged from about $1.55 to about $1.62 per share across data providers. [4] This article uses Finnhub’s figure of about $1.62 as its named source and states the range rather than presenting any single number as “the” consensus.
| Measure | Published by | Figure for Q2 2026 |
| Revenue outlook | AMD (the company) | approx. $11.2bn, plus or minus $300m |
| Revenue estimate | Finnhub (consensus of analysts) | approx. $11.38bn |
| Non-GAAP gross margin outlook | AMD (the company) | approximately 56% |
| EPS estimate | data providers (range observed) | approx. $1.55 to $1.62 |
Where the estimate sits relative to the company’s own outlook
AMD guided to revenue of approximately $11.2 billion plus or minus $300 million, which describes a range of roughly $10.9 billion to $11.5 billion. [2] Finnhub’s revenue estimate of about $11.38 billion sits inside that range, toward its upper half. [4]
That is a factual comparison of two published figures and nothing more. It is not a prediction that either will prove correct, it does not indicate what AMD will report, and it does not indicate how the market will respond. Note also that this compares one provider’s estimate against the company’s outlook; another provider’s figure sits somewhere else. Guidance and consensus are separate quantities published by different parties, and they need not agree.
GAAP or non-GAAP? On AMD the gap is large
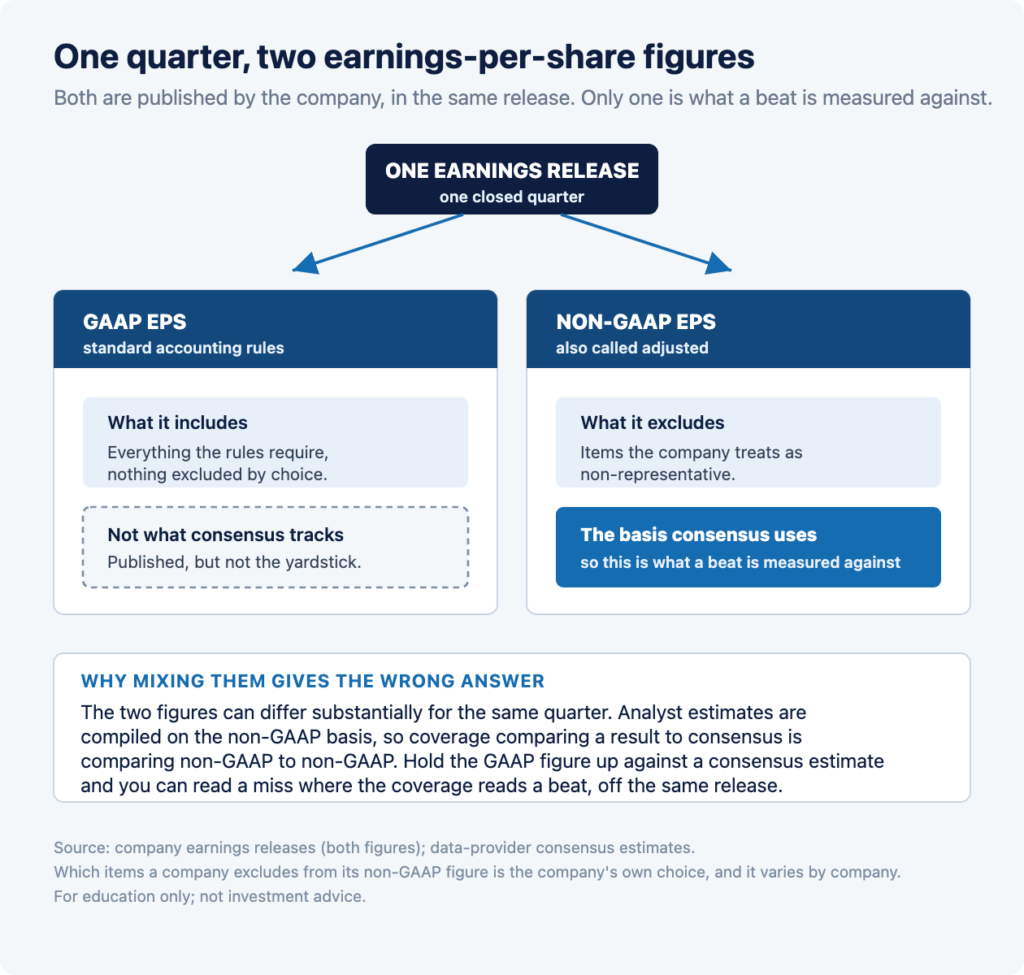
This distinction applies to every company that reports on both bases. On AMD the gap between them is wide, and a reader who misses it draws the wrong conclusion about the quarter.
AMD’s last quarter, on both bases
In its Q1 2026 results, AMD reported GAAP diluted earnings per share of $0.84 and non-GAAP diluted earnings per share of $1.37. [2] Two figures, same quarter, same release, and the non-GAAP number is roughly 63% higher than the GAAP one.
Which one a “beat” is measured against
Analyst consensus for AMD is compiled on the non-GAAP basis, so the surprise figures reported in earnings coverage compare non-GAAP results to non-GAAP estimates. That is what the surprise history below reflects: Finnhub records AMD’s Q1 2026 “actual” as $1.37, which is the non-GAAP figure, not the $0.84 GAAP figure from the same release. [2] [4]
A reader comparing AMD’s GAAP EPS against a consensus estimate would conclude the company missed by a wide margin when the coverage says it beat. Both statements would be describing the same release. The basis is doing all the work.
What did AMD’s last reported quarter show?
The most recent reported quarter is Q1 2026, released May 5, 2026. Per the company’s own release: [2]
- Revenue: $10.3 billion, up 38% year over year.
- Data Center segment revenue: $5.8 billion, up 57% year over year.
- Client and Gaming segment revenue: $3.6 billion, up 23% year over year.
- GAAP diluted EPS: $0.84; non-GAAP diluted EPS: $1.37.
- GAAP net income: $1.383 billion; non-GAAP net income: $2.265 billion.
- GAAP gross margin: 53%; non-GAAP gross margin: 55%.
These are the company’s reported figures for a quarter that has already closed. They describe what happened, not what will happen, and past growth rates are not an indication of future results.
How has AMD surprised in recent quarters?
The table below shows reported non-GAAP EPS against the consensus estimate for the last four reported quarters, per Finnhub. It is history, and it carries no information about the upcoming quarter.
| Quarter | Consensus estimate | Reported (non-GAAP) | Surprise |
| Q1 2026 (ended Mar 31) | $1.3074 | $1.37 | +$0.063 (+4.8%) |
| Q4 2025 (ended Dec 31) | $1.3324 | $1.53 | +$0.198 (+14.8%) |
| Q3 2025 (ended Sep 30) | $1.175 | $1.20 | +$0.025 (+2.1%) |
| Q2 2025 (ended Jun 30) | $0.4961 | $0.48 | -$0.016 (-3.2%) |
There is a miss in this table, and it is worth sitting with
Three of these four quarters came in above the consensus estimate. One did not. In Q2 2025, AMD’s reported non-GAAP EPS of $0.48 came in below the $0.4961 estimate, a negative surprise of about 3.2%. [4]
Two things follow, and both are factual rather than interpretive. First, a company that beats frequently does not beat always, and a table of recent beats is not a pattern with predictive content. Second, the quarter that missed is Q2 of the prior year, which is the same quarter of the calendar now being previewed. That is a coincidence of the calendar, not a mechanism, and it should not be read as one. It is included because omitting it would leave a reader with the impression that AMD has beaten every time recently, which the data does not support.
Note also that the estimate column is one provider’s figure. As set out above, other providers published different estimates for the same quarters, so a surprise calculated elsewhere may differ in size, and a small negative surprise on one provider’s number could be a small positive one on another’s.
On that quarter, this is not hypothetical
The Q2 2025 row is a live demonstration of exactly that point. The estimate this page cites for the quarter is $0.4961, against which the reported $0.48 is a small miss. At least one other data provider published a lower estimate for the same quarter, against which the very same reported $0.48 is a small beat. [4]
Nothing about the company’s result changed between those two readings. The same figure, for the same quarter, is a beat or a miss depending on which provider’s estimate it is set against. That is worth holding onto whenever a headline reports a company “beating” or “missing” by a small margin without saying whose expectation it used.
The gap between providers is wider than most of these surprises
This is worth doing the arithmetic on, because it reframes what a “beat” headline is actually reporting.
The estimate spread across providers for the upcoming quarter is about 7 cents ($1.55 to $1.62). [4] Now compare that against the size of the surprises in the table above: +6.3 cents, +2.5 cents and -1.6 cents in three of the last four quarters. [4]
In other words, for three of those four quarters, the disagreement between data providers about what was expected was larger than the difference between the expectation and the result. Only Q4 2025’s roughly 20-cent surprise clearly exceeded it.
That does not make the surprise meaningless, and it is not a claim about what any future print will do. It is an observation about measurement: when a headline says a company “beat by 3 cents,” the sentence is only as precise as the estimate it is measured against, and that estimate is one provider’s average out of several that differ by more than 3 cents. It is the reason this page names its source and states a range rather than quoting a single number as though it were a fact about the world.
Where does AMD sit in the AI-chip chain?
This is the part of an AMD preview that is specific to AMD rather than generic to earnings, and it is stated here from the company’s own filings rather than from market commentary.
AMD designs; other companies fabricate
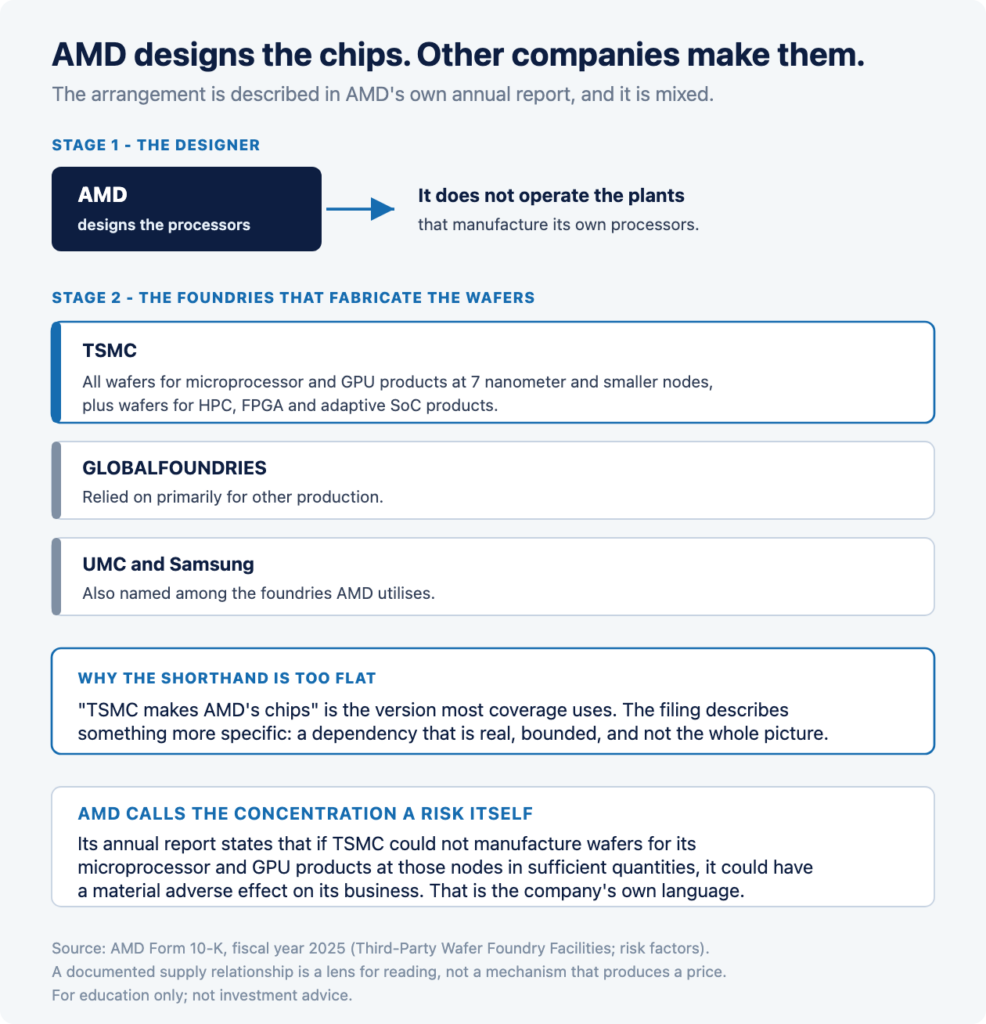
AMD does not operate the fabrication plants that manufacture its own processors. In its Form 10-K for fiscal year 2025, AMD states under “Third-Party Wafer Foundry Facilities” that it “utilize[s] Taiwan Semiconductor Manufacturing Company Limited (TSMC) for the production of wafers for our HPC, FPGA and adaptive SoC products,” and states elsewhere in the same filing that it “rel[ies] on Taiwan Semiconductor Manufacturing Company Limited (TSMC) for the production of all wafers for microprocessor and GPU products at 7 nanometer (nm) or smaller nodes.” [3]
The precision matters, and most coverage skips it
“TSMC makes AMD’s chips” is the shorthand, and it is too flat to be accurate. AMD’s own filing describes a mixed arrangement: it relies on TSMC for all wafers at 7nm and smaller for microprocessors and GPUs, relies primarily on GLOBALFOUNDRIES for other production, and additionally names TSMC, United Microelectronics Corporation (UMC) and Samsung Electronics among the foundries it uses. [3] So the dependency is real, specific, and bounded, rather than total.
AMD identifies this as a risk itself
The company does not present the arrangement as costless. Its own 10-K states that “if TSMC is not able to manufacture wafers for our microprocessor and GPU products at 7 nm or smaller nodes and our newest IC products in sufficient quantities to meet customer demand, it could have a material adverse effect on our business,” and notes that it is “presently focusing our 7 nm and lower product microprocessor and GPU portfolio on TSMC’s processes.” [3] That is the issuer’s own characterization of its own concentration, in a filing made under penalty of law, and it is a firmer basis for the point than any outside commentary.
What the read-through is, and what it is not
Because that supply relationship is documented, results and commentary from a foundry are read by market participants as carrying information relevant to the companies whose products it manufactures, and vice versa. The relationship runs in both directions: a foundry’s reported volumes reflect what its customers ordered, and a customer’s reported demand reflects what it will need manufactured. Neither company’s numbers are a substitute for the other’s.
That is a lens for reading, not a mechanism that produces a price. It is also a chain with more than one link: because AMD names several foundries rather than one, a read-through from any single foundry covers part of AMD’s production and not all of it. [3] A foundry’s reported quarter describes the foundry’s quarter. It does not determine what a customer will report, it does not determine how either company’s shares will respond, and the direction of any relationship is not knowable in advance. Our AI stocks guide covers the wider capex chain these companies sit inside.
How the market commonly reads a chip print
Coverage of a semiconductor company’s results generally distinguishes between the reported figures, the outlook issued with them, and the segment detail underneath. AMD reports revenue by segment, and its Q1 2026 release separated Data Center from Client and Gaming, so the composition of a quarter is visible in the release itself rather than only in the commentary. [2]
Why the outlook often draws more attention than the quarter
Results describe a quarter that closed more than a month earlier. The outlook addresses the one currently underway. A company can report a closed quarter that reads one way and issue an outlook that reads another, without either being contradictory, and market commentary frequently attributes a reaction to the second rather than the first.
A beat is not a direction
A company can report results above consensus and its shares can still fall; the reverse also happens. What was already priced in before the release, the outlook issued alongside it, and the mix within the quarter all contribute to the reaction, not the headline figure by itself. This mechanic is not specific to AMD and is covered in full in our guide to how earnings move stocks.
The sessions involved
Because the release lands after the close and the call follows at 5:00 p.m. ET, the reading happens across the after-hours session and into the next morning rather than inside a single regular session. Those sessions carry thinner liquidity and wider spreads, prices in them can move quickly in either direction, and reversals between the initial reaction and the following session are common enough to be unremarkable. Trading those conditions involves substantial risk. Most day traders lose money.
Risks and limitations
- The next print is not knowable. Nothing here forecasts AMD’s Q2 results, its outlook, or the share-price reaction to either.
- Estimates move. The figures here were retrieved on a stated date and change as analysts revise. Re-check before relying on them.
- The date can change, and third-party calendars have been observed to disagree with the company. AMD’s own announcement is the authority.
- History does not repeat. Three beats and a miss in four quarters is a record, not a pattern.
- The read-through is a lens, not a mechanism. A documented supply relationship does not determine any company’s results or share price.
- Holding through a print is a high-risk activity. A scheduled event can produce a large gap in either direction, and after-hours and premarket sessions carry limited liquidity and wide spreads. Prices can move sharply against a position immediately. Most day traders lose money, and leverage amplifies both gains and losses, meaning you can lose more than you deposit.
- This is not advice. Nothing here is a recommendation to trade any security, at any time, around any event.
What comes next
AMD’s Q2 2026 results are scheduled for Tuesday, August 4, 2026, after the market close, with the call at 5:00 p.m. ET. [1] The company’s Q3 2026 report is currently calendared for November 2, 2026, though that is a data-provider projection rather than a company announcement and should be confirmed against AMD’s own investor-relations releases when it is announced. [4] This page will update with the Q2 figures, a refreshed surprise table and the confirmed Q3 date after the print.
Frequently asked questions
When is AMD’s next earnings date?
AMD will report fiscal second-quarter 2026 results on Tuesday, August 4, 2026, after the market close, with a conference call at 5:00 p.m. ET. The date comes from AMD’s own announcement of July 8, 2026, which is the authoritative source rather than a third-party earnings calendar.
What time does AMD report earnings?
The results are published after the close of U.S. markets, which is 4:00 p.m. ET, and management holds its conference call at 5:00 p.m. ET. Because the release lands after the close, the first regular session in which markets can respond opens at 9:30 a.m. ET the next morning.
What is the consensus estimate for AMD’s quarter?
Published estimates retrieved on July 17, 2026 ranged from roughly $1.55 to $1.62 per share depending on the data provider. This page cites Finnhub’s figure of about $1.62. A consensus is an average of analyst forecasts assembled by a provider, not an official company figure.
What revenue has AMD guided to for the quarter?
In its first-quarter 2026 results, AMD said it expects second-quarter revenue of approximately $11.2 billion, plus or minus $300 million, and non-GAAP gross margin of approximately 56 percent. That describes a range of roughly $10.9 to $11.5 billion. Guidance is published by the company itself, unlike a consensus estimate, which is an average assembled by a data provider.
What did AMD report last quarter?
For the first quarter of 2026, released May 5, 2026, AMD reported revenue of $10.3 billion, up 38% year over year, with Data Center revenue of $5.8 billion, up 57%, and Client and Gaming revenue of $3.6 billion, up 23%. GAAP diluted EPS was $0.84 and non-GAAP diluted EPS was $1.37, on a non-GAAP gross margin of 55 percent.
Why is AMD’s GAAP EPS so different from its non-GAAP EPS?
Non-GAAP figures exclude items the company treats as non-representative. For AMD’s first quarter of 2026 the two differ substantially: $0.84 on a GAAP basis against $1.37 non-GAAP. Consensus estimates are compiled on the non-GAAP basis, so that is what a reported beat or miss is measured against.
Does TSMC manufacture AMD’s chips?
Per AMD’s own annual report, AMD relies on TSMC for the production of all wafers for its microprocessor and GPU products at 7 nanometer or smaller nodes, and also uses other foundries including GLOBALFOUNDRIES, UMC and Samsung. AMD identifies the concentration as a risk to its business.
Has AMD always beaten its earnings estimates?
No. Across the last four reported quarters AMD came in above the consensus estimate three times and below it once: in the second quarter of 2025 its non-GAAP EPS of $0.48 was below the $0.4961 estimate. Past results are a record, not an indication of any future quarter.
References
[1] Advanced Micro Devices, Inc., “AMD to Report Fiscal Second Quarter 2026 Financial Results,” July 8, 2026. https://www.amd.com/en/newsroom/press-releases/2026-7-8-amd-to-report-fiscal-second-quarter-2026-financial.html
[2] Advanced Micro Devices, Inc., “AMD Reports First Quarter 2026 Financial Results,” May 5, 2026. https://ir.amd.com/news-events/press-releases/detail/1284/amd-reports-first-quarter-2026-financial-results
[3] Advanced Micro Devices, Inc., Form 10-K for the fiscal year ended December 27, 2025, filed with the U.S. Securities and Exchange Commission February 4, 2026 (CIK 0000002488). https://www.sec.gov/Archives/edgar/data/2488/000000248826000018/amd-20251227.htm
[4] Finnhub, earnings calendar and company earnings surprise data for AMD, retrieved via the Finnhub API on July 17, 2026: endpoints /api/v1/calendar/earnings?symbol=AMD and /api/v1/stock/earnings?symbol=AMD. These endpoints require an API key, so the figures cannot be reproduced from a public link; the raw, unedited API responses as retrieved on that date are retained on file and are available to reviewers on request. Provider documentation: https://finnhub.io/docs/api/company-earnings
[5] New York Stock Exchange, “Hours and Calendars.” https://www.nyse.com/trade/hours-calendars
Disclosures: Trading involves substantial risk and is not suitable for every investor. Capital is at risk and most day traders lose money. Leverage amplifies both gains and losses, and you can lose more than you deposit. Client accounts are not SIPC or FSCS insured. Extended-hours trading carries additional risk, including lower liquidity and wider spreads. This content is provided for information and education only, for self-directed traders. It is not investment advice or a recommendation of any security, strategy, or account type. Advanced Micro Devices, Inc. and any other company named here appear solely as the factual subjects of scheduled corporate events or of disclosures in public filings; naming them is not a recommendation. Figures are sourced from Advanced Micro Devices, Inc., the U.S. Securities and Exchange Commission, and Finnhub as dated above. See our full disclosures and policies.