
The Employment Situation report, commonly called the jobs report, is released by the U.S. Bureau of Labor Statistics at 8:30 a.m. Eastern Time. The next release is scheduled for August 7, 2026, at 8:30 a.m. ET, covering July 2026 data. In the most recent report, covering June 2026, the BLS reported that total nonfarm payroll employment rose 57,000 and the unemployment rate was 4.2 percent, describing both as having “changed little” in the month. [1]
Data on this page is current as of July 17, 2026. It is updated after each release. This content is for information and education only and is not investment advice.
What time is the jobs report released?
The Employment Situation is released at 8:30 a.m. Eastern Time on its scheduled day. The June 2026 release carried the line “8:30 a.m. (ET) Thursday, July 2, 2026.” [1] That is an hour before the regular U.S. equity session opens at 9:30 a.m. ET, per NYSE market hours, [3] so the first reaction appears in index futures and premarket trading rather than in the regular session. Our PCE report guide covers that premarket mechanic in the same detail; it is identical across the 8:30 releases.
The name on the document is not “the jobs report”
There is no BLS publication called the jobs report. The document is the Employment Situation, and the figure most people mean by “the jobs number” is one line inside it: the change in total nonfarm payroll employment. Searching the BLS site for a jobs report returns the Employment Situation, because that is where the number lives.
When is the next jobs report? (2026 schedule)
The next release is Friday, August 7, 2026, at 8:30 a.m. ET, covering July 2026 data. That date is confirmed twice over: it is on the BLS release calendar, [2] and the June release states it at its foot. [1]
| Reference month | Release date | Day of week |
| July 2026 | August 7, 2026 | Friday |
| August 2026 | September 4, 2026 | Friday |
| September 2026 | October 2, 2026 | Friday |
| October 2026 | November 6, 2026 | Friday |
| November 2026 | December 4, 2026 | Friday |
“The first Friday of the month” is a shorthand, not a rule
This is worth knowing because it is repeated everywhere and it is not reliably true. On the BLS’s own published schedule for 2026, of the thirteen listed releases only eight fall on the first Friday of their release month. [2]
There are five exceptions on that schedule, and none is exotic. The June 2026 data was released on Thursday, July 2 rather than Friday, July 3. The January 2026 data was released on Wednesday, February 11. The November 2025 data was released on Tuesday, December 16. And the releases for December 2025 and April 2026 data landed on the second Friday of their months rather than the first. [2]
The reliable version of the rule is simpler: the Employment Situation is generally released early in the month at 8:30 a.m. ET, and the BLS publishes the exact date in advance. Take the date from the calendar, not from the shorthand.
What did the last jobs report show?
The most recent release, published July 2, 2026 and covering June 2026, opened with this sentence: “Both total nonfarm payroll employment (+57,000) and the unemployment rate (4.2 percent) changed little in June, the U.S. Bureau of Labor Statistics reported today.” [1]
The June 2026 figures
- Nonfarm payrolls: +57,000 on the month. [1]
- Unemployment rate: 4.2 percent. [1]
- Average hourly earnings: +13 cents, or +0.3 percent on the month, and +3.5 percent over the 12 months. [1]
- Job gains occurred in professional and business services, social assistance, and health care. [1]
Note the BLS’s own characterization: it described both headline figures as having “changed little.” That is the agency’s language about its own data, and it is a more careful description than most coverage of the same release used.
The jobs report is two separate surveys, not one
This is the single most useful thing to understand about the report, and the BLS states it plainly in the release itself rather than leaving it to be inferred.
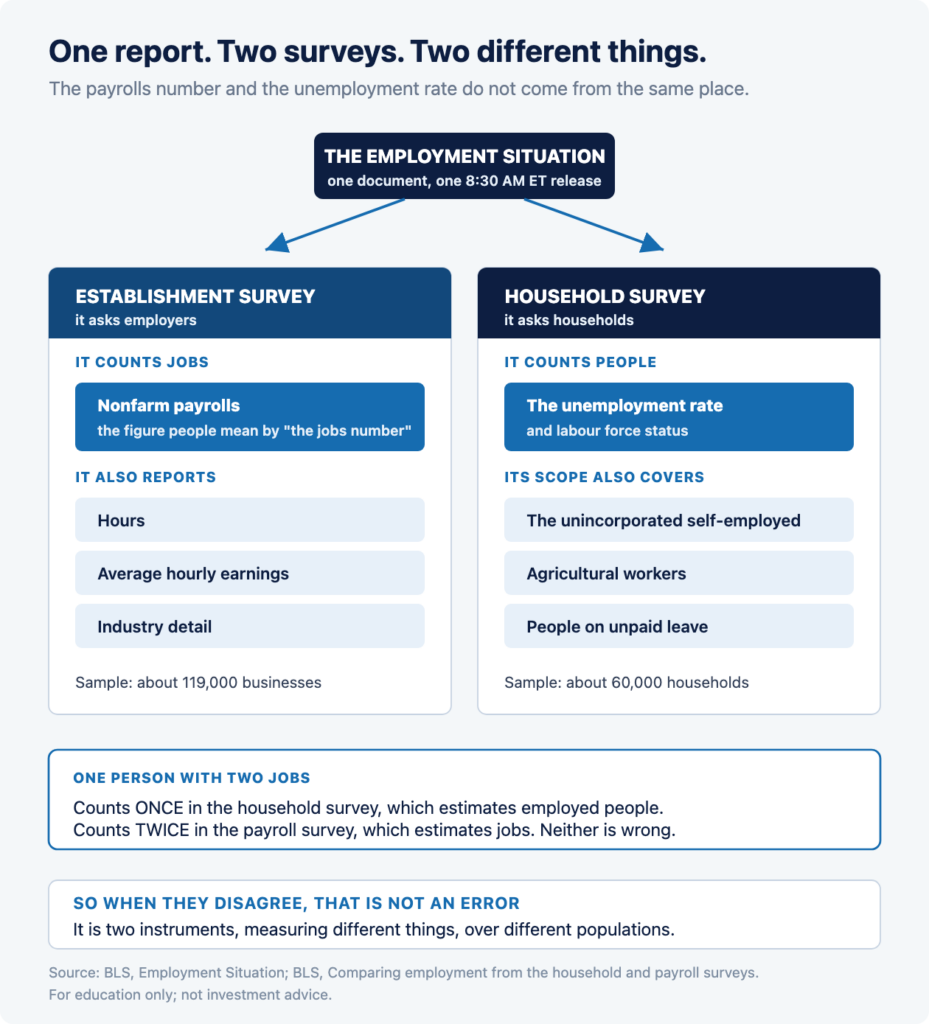
The BLS says so in the document
“This news release presents statistics from two monthly surveys. The household survey measures labor force status, including unemployment, by demographic characteristics. The establishment survey measures nonfarm employment, hours, and earnings by industry.” [1]
Which number comes from which
The two headline figures a reader encounters do not come from the same place:
- The payrolls number, the earnings figures and the hours data come from the establishment survey, which asks employers. [1]
- The unemployment rate, and labour-force status generally, comes from the household survey, which asks households. [1]
Why this matters on release morning
Because they are separate surveys with separate samples and separate methods, they can move in different directions in the same month, and a reader treating the release as one number will find that confusing rather than informative. A month in which payrolls rise while the unemployment rate also rises is not a contradiction or an error; it is two different instruments measuring two different things. The report presents both because both are measured, not because one is a check on the other.
One survey counts people. The other counts jobs.
The BLS publishes a document comparing the two surveys directly, and it contains the single cleanest explanation of why their numbers can diverge. It is not a subtlety buried in a methodology appendix; it is a difference in what is being counted.
The BLS’s own definitions, side by side
- The household survey concept, verbatim: “an estimate of employed people (multiple jobholders are counted only once).” [8]
- The payroll survey concept, verbatim: “an estimate of jobs (multiple jobholders are counted for each nonfarm payroll job).” [8]
One person holding two jobs is one employed person in the household survey and two jobs in the payroll survey. Neither figure is wrong. They are answers to different questions.
They also cover different workers
The household survey’s scope is the “civilian noninstitutional population age 16 and over,” and it includes categories the payroll survey does not: the unincorporated self-employed, agricultural workers, unpaid family workers in family businesses, workers in private households, and people on unpaid leave from their jobs. [8] The payroll survey, by design, measures “employment, hours, and earnings in the nonfarm sector, with industry and geographic detail.” [8]
So somebody working for themselves without incorporating shows up in the unemployment rate’s survey and not in the payrolls number at all.
And they are drawn from very different samples
The household survey is a monthly sample of approximately 60,000 eligible households. The payroll survey is a monthly sample of approximately 119,000 businesses and government agencies, representing about 622,000 individual worksites. [8]
What to do with this
When a headline says the jobs report “sent mixed signals,” this is very often what it is describing: two surveys, counting different things, over different populations, from different samples, published in the same document on the same morning. Knowing which number came from which survey turns an apparent contradiction into two separate pieces of information.
What is in the report, and what does NFP mean?
“NFP” is simply an abbreviation of nonfarm payrolls, the change in the number of paid jobs on employer payrolls excluding farm work, and some other categories the BLS defines. It is the establishment survey’s headline line, and it is the figure most commonly meant by “the jobs number.”
The three figures that draw most of the attention
1. Nonfarm payrolls, the monthly change in jobs on employer payrolls, from the establishment survey.
2. The unemployment rate, from the household survey.
3. Average hourly earnings, from the establishment survey, reported both as a monthly change and as a 12-month change. In June 2026 those were +0.3 percent and +3.5 percent respectively. [1]
The release also carries industry detail, hours worked, and labour-force participation, all of which sit inside the document rather than in the headline.
Why can the revisions be larger than the headline?
This is the part of the jobs report that is routinely missed, and June 2026 is an unusually clean demonstration of it.
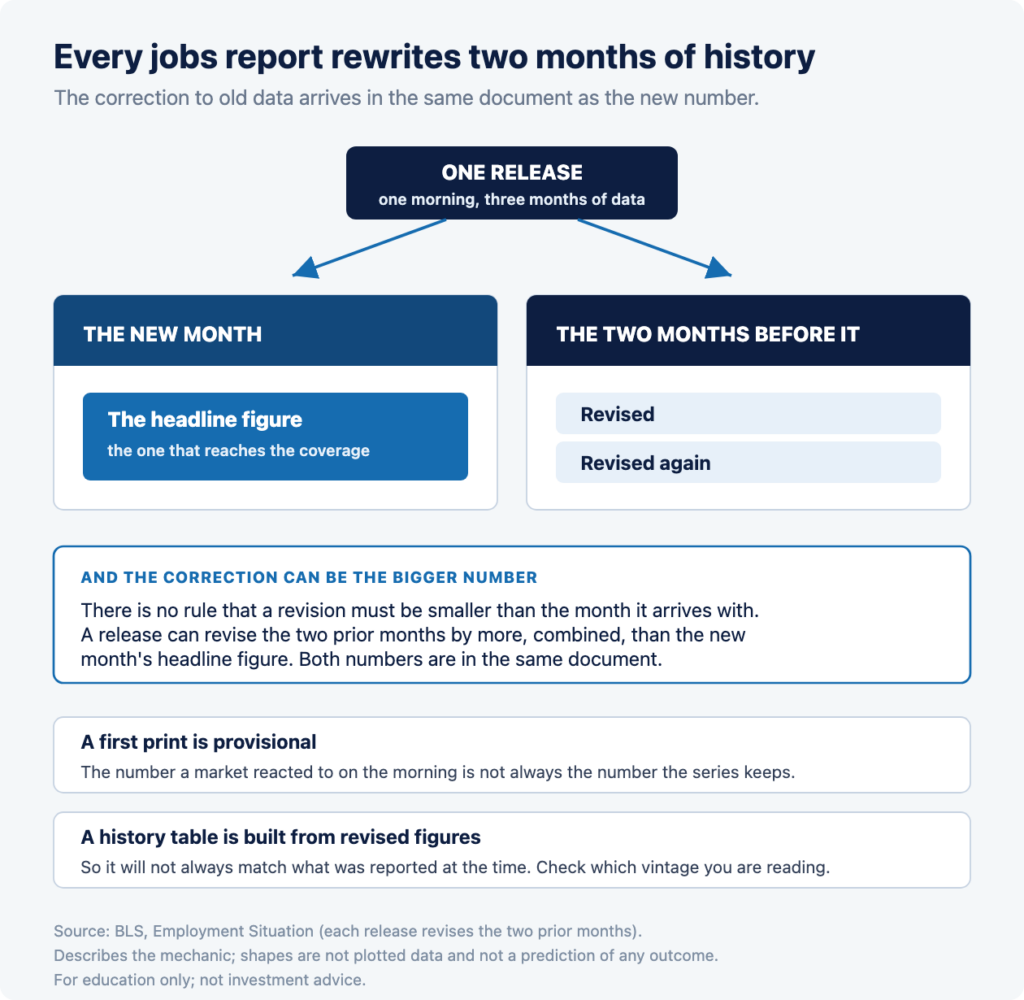
Every release revises the two previous months
The Employment Situation does not only report a new month. It also revises the two months before it, in the same document, every time.
What that looked like in June
From the June 2026 release, verbatim: “The change in total nonfarm payroll employment for April was revised down by 31,000, from +179,000 to +148,000, and the change for May was revised down by 43,000, from +172,000 to +129,000. With these revisions, employment in April and May combined is 74,000 lower than previously reported.” [1]
Now set that against the headline in the same release. June’s payrolls figure was +57,000. The combined revision to April and May was 74,000 lower. [1]
The correction to old data was larger in magnitude than the new data point the release was reporting. Both numbers were published in the same document, on the same morning. A reader who took only the +57,000 away from that release took away the smaller of the two facts.
What follows from this
Two things, both factual. First, a jobs figure is provisional when it is first published, and the number a market saw on release morning is not necessarily the number that ends up in the series. Second, a historical table of payroll changes assembled today is built from revised figures, so it will not always match what was reported at the time. The trend table further down this page is the current vintage and says so.
Why does the jobs report matter to the Federal Reserve?
Because it measures the half of the Fed’s mandate that the inflation reports do not.
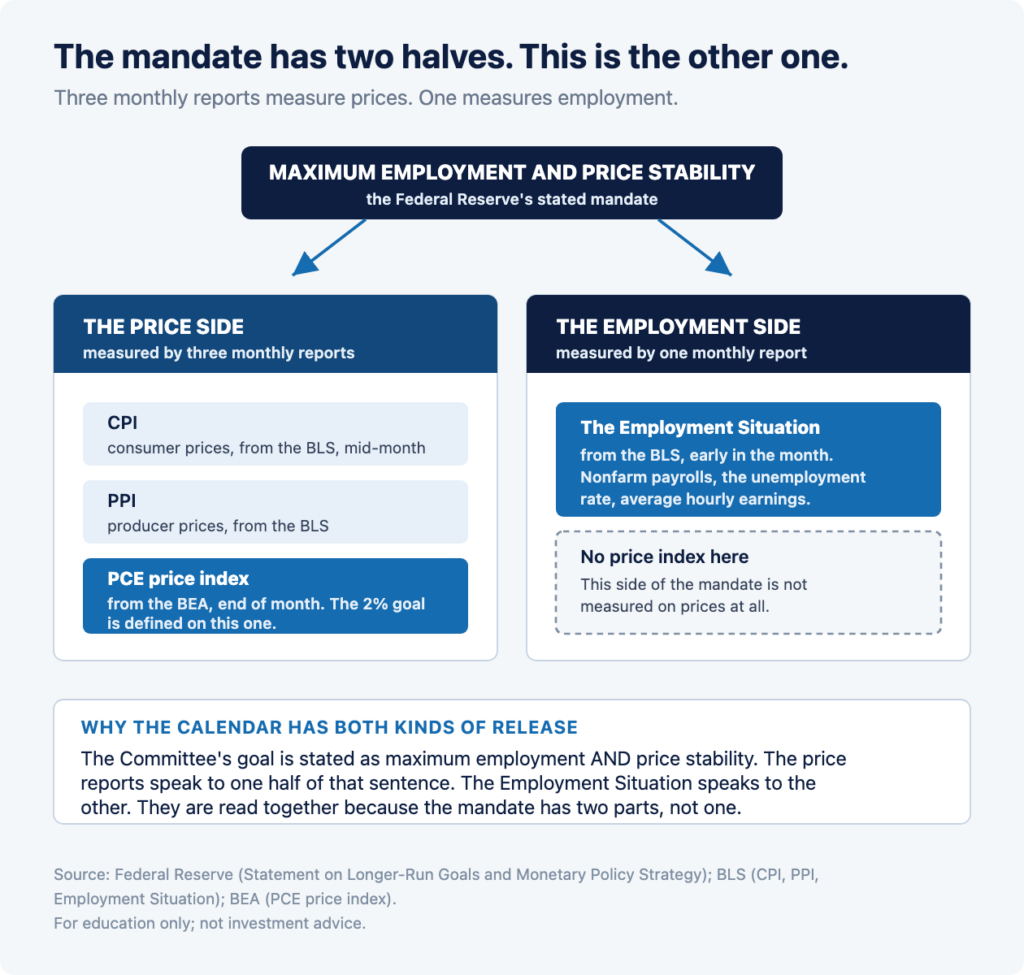
The two halves
The Federal Open Market Committee judges that inflation of 2 percent over the longer run, as measured by the annual change in the price index for personal consumption expenditures, is most consistent with the Federal Reserve’s mandate for maximum employment and price stability. [6] Price stability is measured on prices. Maximum employment is not.
That is why the monthly data calendar has both kinds of release, and why they are read together rather than in isolation:
- The price side: our guides to the CPI report and the PCE report cover the inflation measures, including the one the Fed’s own goal is defined on.
- The employment side: this report.
Where rates stand
As of July 17, 2026, the federal funds target range is 3.50 percent to 3.75 percent, per Federal Reserve data carried by FRED, and it has stood at that range since December 2025. [5] Each Employment Situation becomes part of the evidence the Committee weighs on the employment half of that mandate.
How is employment trending? (13-month history)
| Month | Payroll change | Unemployment rate |
| Jun 2026 | +57,000 | 4.2% |
| May 2026 | +129,000 | 4.3% |
| Apr 2026 | +148,000 | 4.3% |
| Mar 2026 | +214,000 | 4.3% |
| Feb 2026 | -156,000 | 4.4% |
| Jan 2026 | +160,000 | 4.3% |
| Dec 2025 | -17,000 | 4.4% |
| Nov 2025 | +41,000 | 4.5% |
| Oct 2025 | -140,000 | not available |
| Sep 2025 | +76,000 | 4.4% |
| Aug 2025 | -70,000 | 4.3% |
| Jul 2025 | +64,000 | 4.3% |
| Jun 2025 | -20,000 | 4.1% |
Note: the unemployment rate for October 2025 is not available in the published series and is shown as such rather than interpolated. Average hourly earnings rose 3.5% over the 12 months to June 2026. [1] [4]
Reading the table
The monthly payroll change is volatile in both directions over this window, and the unemployment rate moves in a much narrower band, between 4.1 and 4.5 percent. That contrast is itself the two-survey point in numerical form: the two figures are measured differently and they do not move together month to month.
Two rows of that table are visibly revised figures
This is where the revision point stops being abstract. Look at April and May in the table above: +148,000 and +129,000. Neither is the number that was published on the morning those months were first reported.
April has now been published three different ways, in three consecutive months:
1. It was first reported as +115,000 on May 8, 2026. The release opened: “Total nonfarm payroll employment edged up by 115,000 in April.” [9]
2. The June 5 release revised it up by 64,000, “from +115,000 to +179,000.” [10]
3. The July 2 release revised it down by 31,000, “from +179,000 to +148,000”, which is the figure the table shows today. [1]
May has been published twice. It was first reported as +172,000 on June 5, [10] then revised down by 43,000 to +129,000 in the July release. [1]
So a reader comparing this table against how markets behaved on those mornings would be comparing today’s numbers against yesterday’s reactions. The market on May 8 responded to +115,000, a figure that appears nowhere in the data today. That is not a flaw in the table or in the data. It is what a provisional statistic looks like once better information has arrived, and it is why this table’s caption states which vintage it is.
The revisions do not all go one way
This is worth stating explicitly, because a reader who has only seen the June-to-July example could reasonably conclude that revisions mean “the number gets worse later.” They do not.
The July release revised its two prior months down by a combined 74,000. [1] The June release immediately before it revised its two prior months up by a combined 93,000: March from +185,000 to +214,000, and April from +115,000 to +179,000. [10]
Two consecutive releases, revisions in opposite directions, of comparable size. A revision is a correction, not a direction.
The unemployment rate does not work the same way
The monthly revision described above applies to the payroll figures, from the establishment survey. The BLS Technical Note states the difference directly: “In the household survey, new seasonal factors are used to adjust only the current month’s data. In the establishment survey, however, new seasonal factors are used each month to adjust the three most recent monthly estimates. The prior 2 months are routinely revised.” [11]
So the two headline numbers in one document sit on two different revision schedules, just as they come from two different surveys.
How have jobs mornings coincided with moves in rate expectations?
One way to observe how the market absorbed a release is the 2-year Treasury yield, which is viewed by market participants as a prominent indicator of near-term rate expectations.
| Release date (data month) | Session before | Release day | Next session |
| Jul 2, 2026 (June data) | 4.17 | 4.14 | 4.13 |
| Jun 5, 2026 (May data) | 4.05 | 4.17 | 4.15 |
| May 8, 2026 (April data) | 3.92 | 3.90 | 3.95 |
What the table does and does not show
Across these three releases the 2-year yield settled lower on the release day than the session before in two cases and higher in one. There is no direction to read out of three data points, each of those sessions contained many other pieces of news, and a similar print can produce a different reaction in a different context. It is shown as a record of what happened, not as an indication of what any future release will do.
Why the August 7 release sits in a particular spot
The July release lands about a week after the Federal Open Market Committee’s July 28 to 29 meeting. [7] The Committee will therefore have made its July decision before this employment reading is public, which makes it one of the first major data points of the new intermeeting period. Our guide to Fed decision day covers the meeting mechanics themselves.
That is a statement about the calendar. It does not indicate what the report will contain, how the Committee will read it, or what any market will do in response.
It will also rewrite two months that are already public
One thing about the August release is knowable in advance without forecasting anything: because every Employment Situation revises the two prior months, the August 7 release will revise May and June. [1]
June’s +57,000 and May’s +129,000 are therefore both provisional today, and May’s +129,000 is itself already a revision of the +172,000 first reported for that month. [1] So a figure this page currently states as the latest reading is a number with at least one more scheduled opportunity to change. That is worth knowing before treating any single month’s payroll figure as settled.
How the market commonly reads jobs morning
A common observation about scheduled data releases is that price moves are generally associated less with the level of the number than with its distance from what was already expected. Ahead of each release, economists publish consensus estimates for payrolls and the unemployment rate, and market participants generally regard those expectations as reflected in prices before 8:30 a.m. ET.
The report gives commentary more than one number to work with
Because the release carries payrolls, the unemployment rate, average hourly earnings and revisions to two prior months, coverage of a single jobs morning can reasonably emphasise different parts of the same document. A release can show payrolls above expectations and average hourly earnings below them, and which of those a given piece of commentary leads with is an editorial choice, not a fact about the release.
The premarket session
Because the release is premarket, the first reaction appears in index futures and premarket equity trading, where liquidity is limited and spreads are typically wider than in regular hours. Fast moves in both directions, and reversals as participants read the detail underneath the headline, are common in the first minutes after a print. Those conditions carry substantial risk. Most day traders lose money. General risk-control concepts are covered on our position sizing and risk controls page.
Risks and limitations
- The next print is not knowable. Nothing on this page forecasts the July figures or any market reaction to them.
- The figures get revised, substantially. As set out above, every release revises the two prior months, and in June 2026 the combined revision exceeded the new month’s headline. [1]
- Historical reactions do not repeat. The yield table records three specific releases. Markets respond to many simultaneous drivers.
- The two surveys can disagree, and neither is a correction of the other.
- Scheduled data is a high-risk trading environment. The reaction is compressed into seconds, in a premarket session with thin liquidity and wide spreads. Prices can move sharply against a position immediately. Most day traders lose money, and leverage amplifies both gains and losses, meaning you can lose more than you deposit.
- This is not advice. Nothing here is a recommendation to trade any instrument, at any time, around any event.
What comes next
The next Employment Situation lands August 7, 2026, at 8:30 a.m. ET, covering July data, about a week after the July FOMC decision. [1] [2] [7] It will carry a new month’s payrolls and unemployment rate, and it will revise May and June. [1] This page will update with the July figures and refreshed tables after the release. The release after it is scheduled for September 4, 2026. [2]
Frequently asked questions
What time is the jobs report released?
The Employment Situation is released by the Bureau of Labor Statistics at 8:30 a.m. Eastern Time on its scheduled day. That is one hour before the regular U.S. equity session opens at 9:30 a.m. ET, so the first reaction appears in index futures and premarket trading rather than in the regular session.
When is the next jobs report?
The next release is Friday, August 7, 2026, at 8:30 a.m. ET, covering July 2026 data. The date is confirmed both on the BLS release calendar and at the foot of the June release. The following release is scheduled for September 4, 2026, covering August data.
Is the jobs report always on the first Friday of the month?
No. That is a shorthand rather than a rule. On the BLS schedule for 2026, only eight of the thirteen listed releases fall on the first Friday of their month. June 2026 data was released on a Thursday and January 2026 data on a Wednesday. The BLS publishes each date in advance.
What did the last jobs report show?
For June 2026, released July 2, 2026, the BLS reported nonfarm payrolls up 57,000 and an unemployment rate of 4.2 percent, describing both as having changed little. Average hourly earnings rose 13 cents, or 0.3 percent, and were up 3.5 percent over the year.
What does NFP mean?
NFP stands for nonfarm payrolls: the monthly change in the number of paid jobs on employer payrolls, excluding farm work and certain other categories the BLS defines. It comes from the establishment survey, and it is the figure most people mean when they say “the jobs number.”
Why do payrolls and the unemployment rate sometimes disagree?
They come from two different surveys measuring different things. The BLS defines the household survey as an estimate of employed people, counting a multiple jobholder once, and the payroll survey as an estimate of jobs, counting that person for each job. The two also cover different workers and use different samples.
Does the jobs report get revised?
Yes, every month. Each Employment Situation revises the two prior months. In the June 2026 release the BLS revised April down by 31,000 and May down by 43,000, making the two months combined 74,000 lower than previously reported, against a June headline of +57,000.
Where can I read the official jobs report?
On the Bureau of Labor Statistics website. The release is published at bls.gov/news.release/empsit.nr0.htm and the forward schedule at bls.gov/schedule/news_release/empsit.htm. Reading the release rather than a summary is the only way to see the revisions to the two prior months, the industry detail and the technical notes, none of which reach most headlines.
References
[1] U.S. Bureau of Labor Statistics, “Employment Situation Summary, 2026 M06 Results,” released July 2, 2026. https://www.bls.gov/news.release/empsit.nr0.htm
[2] U.S. Bureau of Labor Statistics, “Schedule of Releases for the Employment Situation,” retrieved July 17, 2026. https://www.bls.gov/schedule/news_release/empsit.htm
[3] New York Stock Exchange, “Holidays & Trading Hours.” https://www.nyse.com/trade/hours-calendars
[4] Federal Reserve Bank of St. Louis (FRED), series PAYEMS, UNRATE and CES0500000003 (BLS data), retrieved July 17, 2026. https://fred.stlouisfed.org/series/PAYEMS
[5] Federal Reserve Bank of St. Louis (FRED), federal funds target range, series DFEDTARU and DFEDTARL, and 2-year Treasury constant maturity, series DGS2, retrieved July 17, 2026. https://fred.stlouisfed.org/series/DGS2
[6] Board of Governors of the Federal Reserve System, “Why does the Federal Reserve aim for inflation of 2 percent over the longer run?” last updated August 22, 2025. https://www.federalreserve.gov/faqs/economy_14400.htm
[7] Board of Governors of the Federal Reserve System, “Meeting calendars and information.” https://www.federalreserve.gov/monetarypolicy/fomccalendars.htm
[8] U.S. Bureau of Labor Statistics, “Comparing employment from the BLS household and payroll surveys,” retrieved July 17, 2026. https://www.bls.gov/web/empsit/ces_cps_trends.htm
[9] U.S. Bureau of Labor Statistics, “The Employment Situation, April 2026,” USDL-26-0687, released May 8, 2026. https://www.bls.gov/news.release/archives/empsit_05082026.htm
[10] U.S. Bureau of Labor Statistics, “The Employment Situation, May 2026,” USDL-26-0786, released June 5, 2026. https://www.bls.gov/news.release/archives/empsit_06052026.htm
[11] U.S. Bureau of Labor Statistics, “Employment Situation Technical Note,” retrieved July 17, 2026. https://www.bls.gov/news.release/empsit.tn.htm
Disclosures: Trading involves substantial risk and is not suitable for every investor. Capital is at risk and most day traders lose money. Leverage amplifies both gains and losses, and you can lose more than you deposit. Client accounts are not SIPC or FSCS insured. Extended-hours trading carries additional risk, including lower liquidity and wider spreads. This content is provided for information and education only, for self-directed traders. It is not investment advice or a recommendation of any security, strategy, or account type. Figures are sourced from the U.S. Bureau of Labor Statistics, the Board of Governors of the Federal Reserve System, and the Federal Reserve Bank of St. Louis (FRED) as dated above. See our full disclosures and policies.