
A stock moves on earnings when the result and the company’s guidance differ from what the market already expected, not simply because profit rose or fell. Before the report, the options market prices an expected move, a range implied by option prices. After the report, implied volatility usually collapses, an effect called IV crush, and the reaction often arrives after hours as an overnight gap. Earnings are a binary event, and most day traders lose money.
This content is for information and education only and is not investment advice. Data is current as of July 3, 2026.
What happens when a company reports earnings?
A quarterly earnings report is a scheduled release in which a public company publishes its results, most importantly earnings per share (EPS) and revenue, along with management’s guidance for future quarters. Companies report either before the market opens (BMO) or after the close (AMC), so the first price reaction usually happens outside regular trading hours.
What is in the report
The headline figures are EPS and revenue, but the guidance often matters more, because it resets expectations for the quarters ahead. Analysts publish consensus estimates in advance, and the market prices in that consensus before the report lands.
When companies report
Most large companies report after the close. Of the marquee names reporting this season, Tesla, Robinhood, Coinbase, AMD, Super Micro, and Nvidia are all scheduled after the close, per the earnings calendar. [1] That timing pushes the reaction into the after-hours and premarket sessions, where liquidity tends to be thinner and spreads are wider than in regular hours. Trading those sessions carries added risk, and you can lose more than you deposit.
Why do stocks move on earnings?
A stock moves on earnings because of the surprise relative to expectations and the forward guidance, not the raw profit number. The market has already priced the consensus estimate, so it is the gap between the actual result and that estimate, plus what management says about the future, that drives the reaction.
The surprise, not the number
Consider the real surprise history below. Nvidia beat its consensus EPS estimate in each of its last four reported quarters, while Tesla and AMD each posted quarters that missed. A beat is common, but it does not guarantee the stock rose: if the market expected an even larger beat, or if guidance disappointed, a stock can fall on a beat.
| Company | Quarter end | Actual EPS | Estimate | Surprise |
| Nvidia (NVDA) | Jun 30, 2026 | 1.87 | 1.79 | +4.3% |
| Nvidia (NVDA) | Mar 31, 2026 | 1.62 | 1.56 | +3.6% |
| Nvidia (NVDA) | Dec 31, 2025 | 1.30 | 1.27 | +2.0% |
| Tesla (TSLA) | Mar 31, 2026 | 0.41 | 0.38 | +8.7% |
| Tesla (TSLA) | Sep 30, 2025 | 0.50 | 0.56 | -10.5% |
| Tesla (TSLA) | Jun 30, 2025 | 0.40 | 0.44 | -8.5% |
| Palantir (PLTR) | Mar 31, 2026 | 0.33 | 0.28 | +15.8% |
| Palantir (PLTR) | Sep 30, 2025 | 0.21 | 0.17 | +22.2% |
| AMD (AMD) | Dec 31, 2025 | 1.53 | 1.33 | +14.8% |
| AMD (AMD) | Jun 30, 2025 | 0.48 | 0.50 | -3.2% |
Real earnings surprise history: actual EPS vs consensus estimate, last reported quarters. Source: Finnhub, retrieved 2026-07-03.
Guidance and the whisper number
Beyond consensus, traders track an unofficial “whisper number,” the expectation the market has really settled on, which can sit above published consensus for a name that habitually beats. When a company clears consensus but misses the whisper, the stock can still fall. This is why the reaction is about expectations, not the absolute figure.
What is the expected move, and how do you read it?
The expected move is the size of the price swing the options market is pricing in for an earnings report, read from option prices before the event. It is a one-standard-deviation range, which means the market is implying a roughly two-in-three chance the stock lands within that range by the option’s expiration.
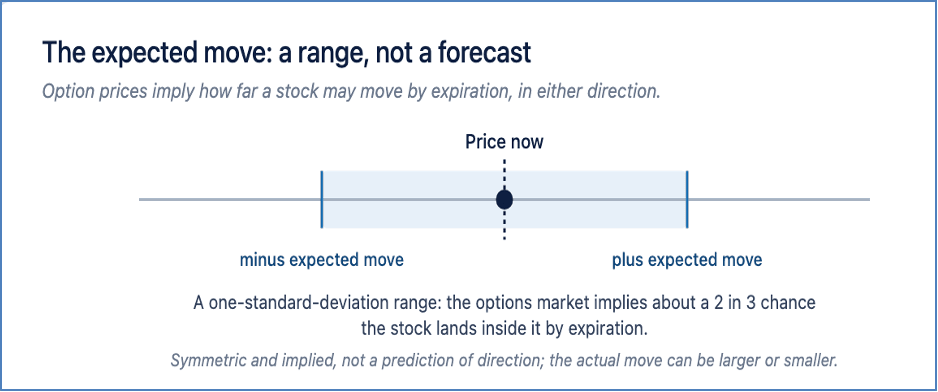
The expected move is a symmetric implied range read from option prices, not a forecast of direction.
Reading it off the straddle
The simplest read is the at-the-money straddle: the price of the nearest at-the-money call plus the price of the nearest at-the-money put. Their combined cost approximates the expected move. As an illustration, if a stock trades at $100 and its at-the-money straddle costs about $8 going into earnings, the options market is implying a move of roughly $8, or about 8% in either direction, by expiration. That figure is symmetric: it says nothing about which way the stock will go.
Why it matters
The expected move frames the risk, not the direction. A stock priced for an 8% move that then moves 3% has made a smaller move than the options market implied, even though 3% is a large day for most stocks. The expected move is an implied range, not a forecast, and the actual move can be larger or smaller.
What is implied volatility, and why does it rise into earnings?
Implied volatility (IV) is the market’s expectation of future price movement, embedded in option prices. It rises in the days before an earnings report because the event concentrates uncertainty into a single moment, and option sellers demand more premium to carry that risk.
The run-up
As the report approaches, the front-month options that expire just after the event carry the highest implied volatility, because they hold the event risk. A single stock’s IV around earnings runs far above the broad market. For context, the Cboe Volatility Index (VIX), which measures expected volatility for the S&P 500, closed at 16.59 on July 1, 2026, a relatively calm reading for the index, while individual names reporting can carry implied volatility several times that level into their reports. [2]
The cost of that premium
Higher implied volatility means richer option prices. A trader who buys an option into earnings is paying up for that elevated volatility, which sets up the effect in the next section.
What is IV crush?
IV crush is the sharp drop in implied volatility that happens right after an earnings report, once the uncertainty resolves. Because implied volatility is a large part of an option’s price into the event, the option can lose value even when the stock moves in the direction the holder expected.
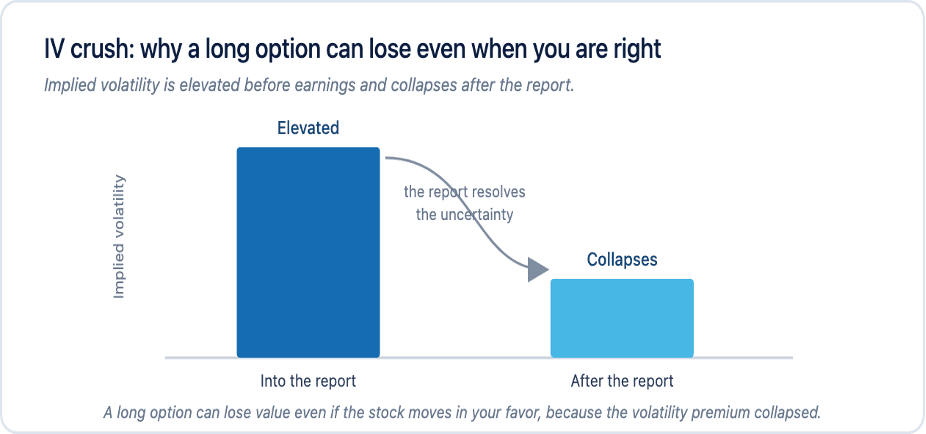
Implied volatility is elevated into earnings and collapses after, so a long option can lose value even when the stock moves in your favor.
A worked illustration
Suppose implied volatility on a stock runs at about 90% the day before earnings and falls to about 45% the morning after, once the result is known. A trader who bought a call purely on that elevated volatility can see the call lose value even if the stock rises modestly, because the volatility component of the price collapsed while the stock’s move was smaller than the expected move. These figures are illustrative, but the mechanism is why being right on direction is not enough to profit from a long option into earnings.
The takeaway
IV crush is the single most common way new options traders lose money around earnings. It is a mechanic to understand, not a strategy to run: selling premium to capture IV crush carries its own assignment and gap risk, covered below and on our options trading page.
After-hours reactions and overnight gaps
Because most companies report outside regular hours, the price reaction shows up first in after-hours trading and then as an overnight gap: the stock opens the next session at a different price from the prior close. A trader holding a position through the report cannot act during the gap itself, only before or after.
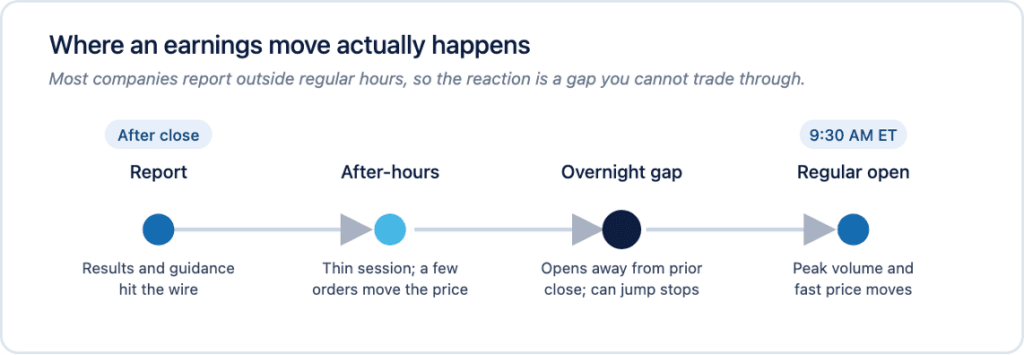
Most companies report outside regular hours, so the reaction arrives as an overnight gap that a trader cannot act inside.
Where the move happens
When a company reports after the close, the news hits a thin after-hours session where a few orders can move the price sharply. By the time the regular session opens at 9:30 a.m. ET, the gap is largely set, and the opening minutes often bring the highest volume and fastest moves of the day. CMEG provides extended-hours access on its platforms, which carries added risk including lower liquidity and wider spreads, and you can lose more than you deposit. The session hours and extended-hours risks are set out in our FAQs.
Gaps and stops
A gap can jump straight through a stop order, so an exit does not necessarily fill near the stop price. This is a core reason earnings are treated as a binary event: the risk is not just the direction, but the size and speed of the gap.
Do earnings gaps continue or fade?
There is no reliable rule that gaps continue or fill; both happen, and neither is a strategy that makes money on its own. Academic research has documented post-earnings-announcement drift, the tendency of stocks to keep moving in the direction of an earnings surprise for a period after the report, but it is a statistical tendency, not a guarantee for any single stock.
What the research says
The drift effect was first documented by Bernard and Thomas in 1989, who found that stocks with large positive surprises tended to keep drifting up, and those with large negative surprises to keep drifting down, for weeks after the report. Later work has debated how much of the effect survives after trading costs. The point for a trader is that the tendency exists in aggregate data, but it does not tell you what one stock will do after one report.
Gap-and-go vs gap-fill
Traders use the terms gap-and-go (the stock continues in the gap direction) and gap-fill (the stock retraces toward the prior close). Both are observed behaviors, not predictions. Treating either as a certainty is how traders get caught on the wrong side of a fast move.
How are options priced around earnings?
Option prices around earnings carry an elevated volatility premium because of the event risk, which is why they are expensive to buy and risky to sell. Understanding both sides of that trade is part of understanding the move.
The buyer’s problem
A buyer pays the inflated premium and faces IV crush, so the stock must move more than the expected move, and in the right direction, for a long option to pay off. That is a high bar.
The seller’s problem
A seller collects the premium and benefits from IV crush, but takes on the risk of a move larger than the expected move, which on a single-name earnings gap can be severe. Selling naked options into earnings exposes the seller to assignment and to a gap far beyond the premium collected. Defined-risk structures limit that exposure, and the options pricing and fees are set out in full. Options carry their own approval requirements and risks and are not suitable for every account.
Three ways traders typically approach an earnings report
Active traders generally take one of three stances into a report, and each carries a different risk profile. None is a recommendation; they are the common approaches, described so a trader understands the trade-offs.
Position into the report
Holding a stock or a long option through the report takes on the full binary event: the maximum exposure to the gap, in both directions. A long option also faces IV crush, so it can lose even on a correct direction call. This is the highest-variance approach, and the loss can be large and immediate.
Stand aside and trade the reaction
A second approach is to hold nothing through the print and instead wait for the regular open, letting the gap set and the after-hours noise clear before deciding. This avoids the gap risk of holding through the event, but the opening minutes are themselves the fastest and highest-volume of the day, with their own slippage risk.
Use defined-risk structures
A third approach uses options structures with a defined maximum loss, such as spreads, so the position cannot lose more than the premium at risk even on a gap beyond the expected move. Defined risk is not the same as low risk, and these structures carry their own complexity, assignment considerations, and account-approval requirements. Our options trading page covers what is available, and risk management covers position sizing and controls.
Whichever stance a trader takes, the event is binary and the outcome is unknown in advance. Most day traders lose money, and nothing here is a recommendation to trade any report.
How do you find earnings dates and expected moves?
Earnings dates come from an earnings calendar, and the expected move is read from the options chain on a trading platform. Knowing the exact date and whether a company reports before the open or after the close is the first step in planning around the event.
The calendar
The table below shows the confirmed report dates and consensus EPS estimates for a set of widely traded names this season. Dates and estimates change, so confirm them before any event.
| Company | Report date | Consensus EPS est. | Timing |
| Tesla (TSLA) | Jul 22, 2026 | 0.45 | after the close |
| Robinhood (HOOD) | Jul 28, 2026 | 0.42 | after the close |
| Strategy (MSTR) | Jul 29, 2026 | 8.63 | – |
| Coinbase (COIN) | Jul 30, 2026 | 0.06 | after the close |
| AMD (AMD) | Aug 3, 2026 | 1.62 | after the close |
| Palantir (PLTR) | Aug 3, 2026 | 0.35 | – |
| Super Micro (SMCI) | Aug 3, 2026 | 0.71 | after the close |
| Nvidia (NVDA) | Aug 25, 2026 | 2.12 | after the close |
Current-season earnings dates and consensus EPS estimates. Source: Finnhub earnings calendar, retrieved 2026-07-03. Confirm before each event.
Reading the expected move
On the platform, pull up the options chain for the expiration just after the report, add the at-the-money call and put prices, and that combined figure approximates the expected move. CMEG’s platforms provide the options data and charting to do this; you can compare the platforms to see the tools each one offers.
What are the risks of trading earnings?
Earnings are a binary event, and the risks are concentrated and fast. The specific hazards are IV crush on long options, gaps that jump through stops, thin after-hours liquidity, and the simple fact that the direction of the move is unknown in advance.
- IV crush: a long option can lose value even when the stock moves your way.
- Gap risk: the stock can open far from the prior close, past any stop, so an exit may not fill near the intended price.
- Thin liquidity: after-hours and premarket spreads are wider, and fills are less predictable.
- Leverage: trading earnings on margin amplifies both gains and losses, and you can lose more than you deposit.
Trading around earnings involves substantial risk, and most day traders lose money. Nothing here is a recommendation to trade any stock or any earnings event.
What active traders watch this season
Around each report, active traders generally watch the print versus consensus and the guidance, the expected move priced by options, the after-hours reaction, and the volatility environment. These are factual watch-items, not signals to trade.
The season runs from Tesla on July 22 through Nvidia on August 25, per the calendar above. Each of those reports has its own preview, and our Knowledge Hub covers the market fundamentals behind them. As always, the material here is for information only and is not investment advice.
Frequently asked questions
Why do stocks move on earnings?
Because the result and guidance differ from what the market already expected. The consensus estimate is priced in before the report, so the stock reacts to the surprise and to the outlook, not to the raw profit figure.
What is the expected move on earnings?
It is the price swing the options market is pricing in, read from option prices before the report. The at-the-money call plus put (the straddle) approximates it. It is a one-standard-deviation range, not a forecast of direction.
What is IV crush?
IV crush is the sharp fall in implied volatility right after an earnings report. Because implied volatility is a big part of an option’s price into the event, a long option can lose value even if the stock moves in the expected direction.
Can a stock fall after beating earnings?
Yes. If the market expected a larger beat, or if guidance disappoints, a stock can fall even after beating consensus. The reaction is about expectations, not the absolute number.
Do earnings gaps get filled?
Sometimes they continue and sometimes they retrace. Both are observed behaviors, not rules. Research has documented a tendency for stocks to drift in the direction of a surprise, but it is a statistical tendency, not a guarantee.
Do most companies report before or after the market?
Many large companies report after the close, which pushes the first reaction into after-hours and premarket trading, where liquidity tends to beis thinner and spreads are wider.
References
[1] Finnhub, company earnings calendar (report dates and consensus EPS estimates), retrieved July 3, 2026. https://finnhub.io
[2] Federal Reserve Bank of St. Louis (FRED), Cboe Volatility Index: VIX (VIXCLS), value for July 1, 2026, retrieved July 3, 2026. https://fred.stlouisfed.org/series/VIXCLS
[3] Bernard, V. and Thomas, J., “Post-Earnings-Announcement Drift: Delayed Price Response or Risk Premium?” Journal of Accounting Research, Vol. 27, 1989.
[4] Finnhub, company earnings (actual EPS vs consensus estimate history), retrieved July 3, 2026. https://finnhub.io
[5] The Options Clearing Corporation (OCC), on options exercise and assignment. https://www.theocc.com
Disclosures: Trading involves substantial risk and is not suitable for every investor. Capital is at risk and most day traders lose money. Options carry additional risks and approval requirements and are not suitable for every account. Leverage amplifies both gains and losses, and you can lose more than you deposit. Client accounts are not SIPC or FSCS insured. Extended-hours trading carries additional risk, including lower liquidity and wider spreads. This content is provided for information and education only. It is not investment advice or a recommendation of any security, strategy, or account type. Company figures are sourced from Finnhub and the volatility figure from FRED as dated above. See our full disclosures and policies.