
The PCE price index is released by the U.S. Bureau of Economic Analysis at 8:30 a.m. Eastern Time, inside the monthly Personal Income and Outlays report. The next release is scheduled for July 30, 2026, at 8:30 a.m. ET, covering June 2026 data. In the most recent report, the PCE price index for May 2026 rose 0.4 percent on the month and 4.1 percent from a year earlier, while the index excluding food and energy rose 0.3 percent on the month and 3.4 percent over the year, according to the BEA. [1]
Data on this page is current as of July 17, 2026. It is updated after each PCE release. This content is for information and education only and is not investment advice.
What time is the PCE report released?
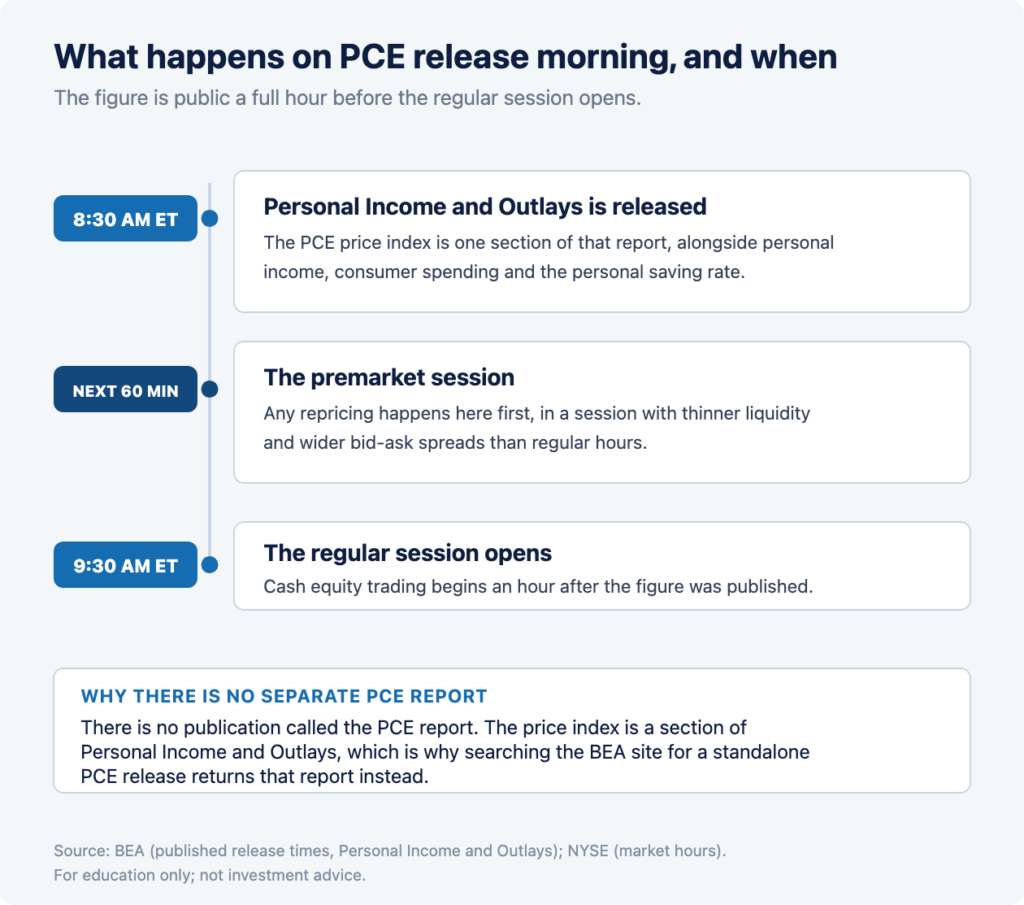
The PCE price index is released at 8:30 a.m. Eastern Time on its scheduled day, as part of the BEA’s Personal Income and Outlays report. The May 2026 release carried the header “EMBARGOED UNTIL RELEASE AT 8:30 a.m. EDT, Thursday, June 25, 2026.” [1] That is one hour before the regular U.S. equity session opens at 9:30 a.m. ET, per NYSE market hours. [2]
It is not a standalone release
A detail that catches people out: there is no report called “the PCE report.” The PCE price index is one section of a broader release called Personal Income and Outlays, which also carries personal income, disposable personal income, consumer spending and the personal saving rate. [1] Searching for a separate PCE publication on the BEA site returns the Personal Income and Outlays release, because that is where the index lives.
Why the exact minute matters
For a scheduled data event, the initial reaction is compressed into the seconds after 8:30 a.m. ET. That happens in a premarket session where liquidity is thinner and bid-ask spreads are typically wider than in regular hours. The BEA publishes the release time in advance, so the figure becomes public an hour before the regular session opens. Trading around scheduled data involves substantial risk, prices can move sharply in either direction, and most day traders lose money.
When is the next PCE report? (2026 schedule)
The next release is Thursday, July 30, 2026, at 8:30 a.m. ET, covering June 2026 data. PCE is published monthly, generally toward the end of the month following the reference month. The remaining 2026 schedule, per the BEA release calendar: [3]
| Reference month | Release date | Time (ET) | Also released that morning |
| June 2026 | July 30, 2026 | 8:30 a.m. | GDP, 2nd Quarter (Advance Estimate) |
| July 2026 | August 26, 2026 | 8:30 a.m. | GDP, 2nd Quarter (Second Estimate) and Corporate Profits |
| August 2026 | September 30, 2026 | 8:30 a.m. | GDP (Third Estimate), Industries, Corporate Profits, State GDP and State Personal Income. This is also the start of the 2026 annual update [1] |
| September 2026 | October 29, 2026 | 8:30 a.m. | GDP, 3rd Quarter (Advance Estimate) |
| October 2026 | November 25, 2026 | 8:30 a.m. | GDP, 3rd Quarter (Second Estimate) and Corporate Profits |
| November 2026 | December 23, 2026 | 8:30 a.m. | GDP (Third Estimate), Industries, Corporate Profits, State GDP and State Personal Income |
Each remaining 2026 release shares its slot with GDP
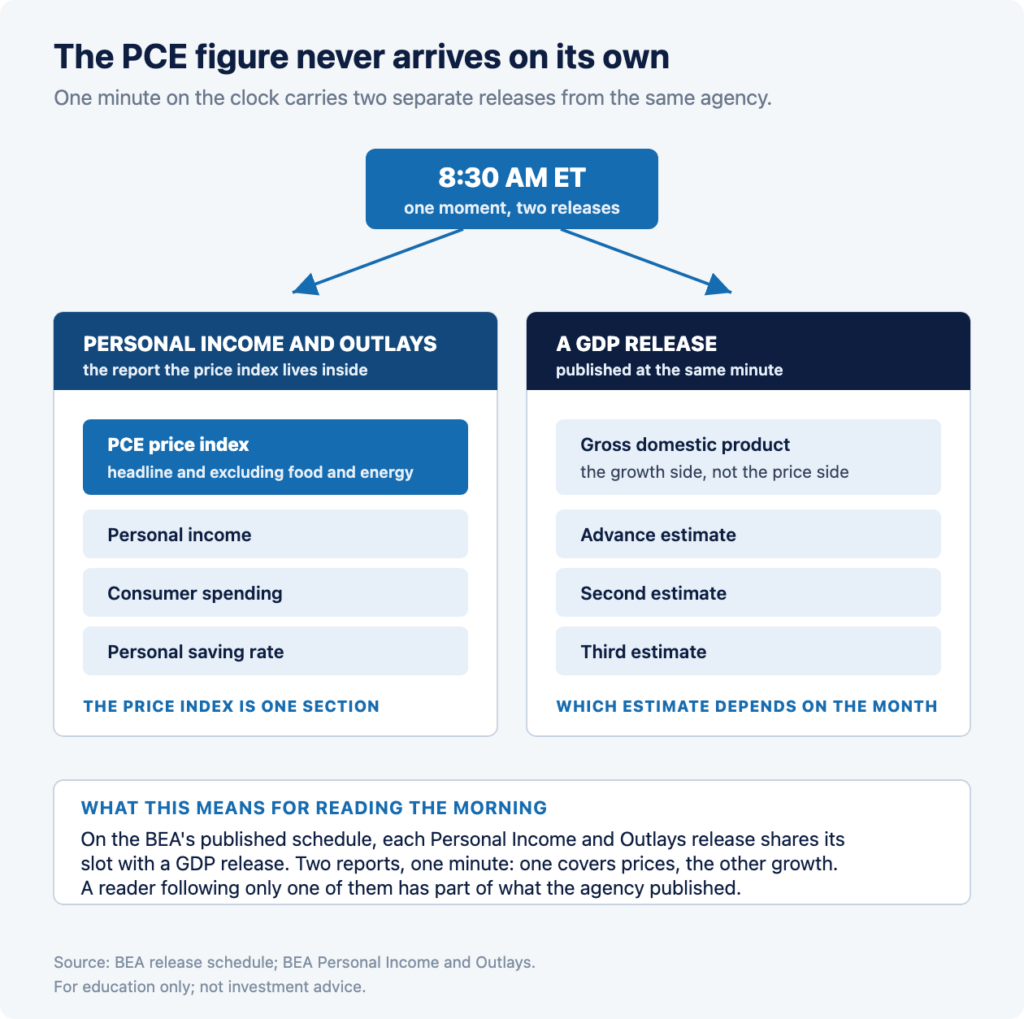
For the remainder of 2026, every Personal Income and Outlays release shares its 8:30 a.m. slot with a GDP release. [3] That means the PCE figure never arrives alone: it lands alongside a second BEA release covering economic growth. The July 30 pairing is with the advance estimate of second-quarter GDP.
What did the last PCE report show?
The most recent release, published June 25, 2026 and covering May 2026, showed the PCE price index up 0.4 percent on the month and 4.1 percent from the same month a year earlier. Excluding food and energy, the index rose 0.3 percent on the month and 3.4 percent over the year. [1]
The May 2026 price figures
- PCE price index: +0.4% month-over-month, matching April’s 0.4 percent. [1]
- PCE price index: +4.1% from the same month one year ago, up from +3.8 percent for the 12 months ending April. [1] [4]
- Core PCE price index (excluding food and energy): +0.3% month-over-month, matching April. [1]
- Core PCE price index: +3.4% over 12 months, up from +3.3 percent through April. [1] [4]
Measured against the published history of the series, the May headline reading of 4.1 percent is the highest 12-month rate since April 2023, and the May core reading of 3.4 percent is the highest since October 2023. [5] Those comparisons are drawn from the current published vintage of the BEA series, as carried by FRED, and reflect that vintage rather than the figures published on each original release morning.
The rest of the release
The price index is only part of Personal Income and Outlays. In the same May report, the BEA recorded personal income up $181.6 billion (0.7 percent on the month), disposable personal income up $164.9 billion (0.7 percent), and current-dollar personal consumption expenditures up $156.1 billion (0.7 percent). Real PCE, which adjusts spending for price changes, rose $43.8 billion (0.3 percent). The $156.1 billion increase in current-dollar spending reflected a $94.3 billion rise in services and a $61.8 billion rise in goods. Personal saving was $704.2 billion, and the personal saving rate was 3.0 percent. [1]
The BEA attributed the May increase in personal income primarily to increases in farm proprietors’ income and compensation. It noted that the farm component reflected a second round of Supplemental Disaster Relief Program payments issued by the U.S. Department of Agriculture, and that the compensation increase was led by private wages and salaries, based on Bureau of Labor Statistics Current Employment Statistics data. [1]
| Measure | April 2026 | May 2026 |
| Current-dollar personal income | 0.0% | +0.7% |
| Current-dollar disposable personal income | -0.1% | +0.7% |
| Real disposable personal income | -0.5% | +0.3% |
| Current-dollar PCE (spending) | +0.4% | +0.7% |
| Real PCE (spending) | 0.0% | +0.3% |
| PCE price index | +0.4% | +0.4% |
| PCE price index excluding food and energy | +0.3% | +0.3% |
What is the PCE price index, and what does it measure?
The personal consumption expenditures price index, produced by the Bureau of Economic Analysis, is described by the agency as a measure of the prices that people living in the United States, or those buying on their behalf, pay for goods and services. [4] That phrase, “or those buying on their behalf,” accounts for several of the documented differences between PCE and other inflation measures.
The scope
Because PCE counts purchases made on a consumer’s behalf, it captures spending that the consumer never pays for directly. Employer-provided health insurance and care paid through government programs are inside the PCE basket, because somebody bought those services on the consumer’s behalf. The BEA describes PCE as capturing inflation across “a wide range of consumer expenses.” [4]
Headline and core
The BEA publishes the all-items index and a variation that excludes food and energy, known as the core PCE price index. The BEA describes the core index as making it easier to see the underlying inflation trend by excluding those two categories, where, in the agency’s words, “prices tend to swing up and down more dramatically and more often than other prices.” The BEA further notes that the core index is “closely watched by the Federal Reserve as it conducts monetary policy.” [6]
Why is the PCE price index tied to the Federal Reserve?
The connection is not a matter of interpretation or market convention. It is written into the Federal Reserve’s own policy framework. In its Statement on Longer-Run Goals and Monetary Policy Strategy, the Federal Open Market Committee judges that inflation of 2 percent over the longer run, as measured by the annual change in the price index for personal consumption expenditures, is most consistent with the Federal Reserve’s mandate for maximum employment and price stability. [7]
What that means in practice
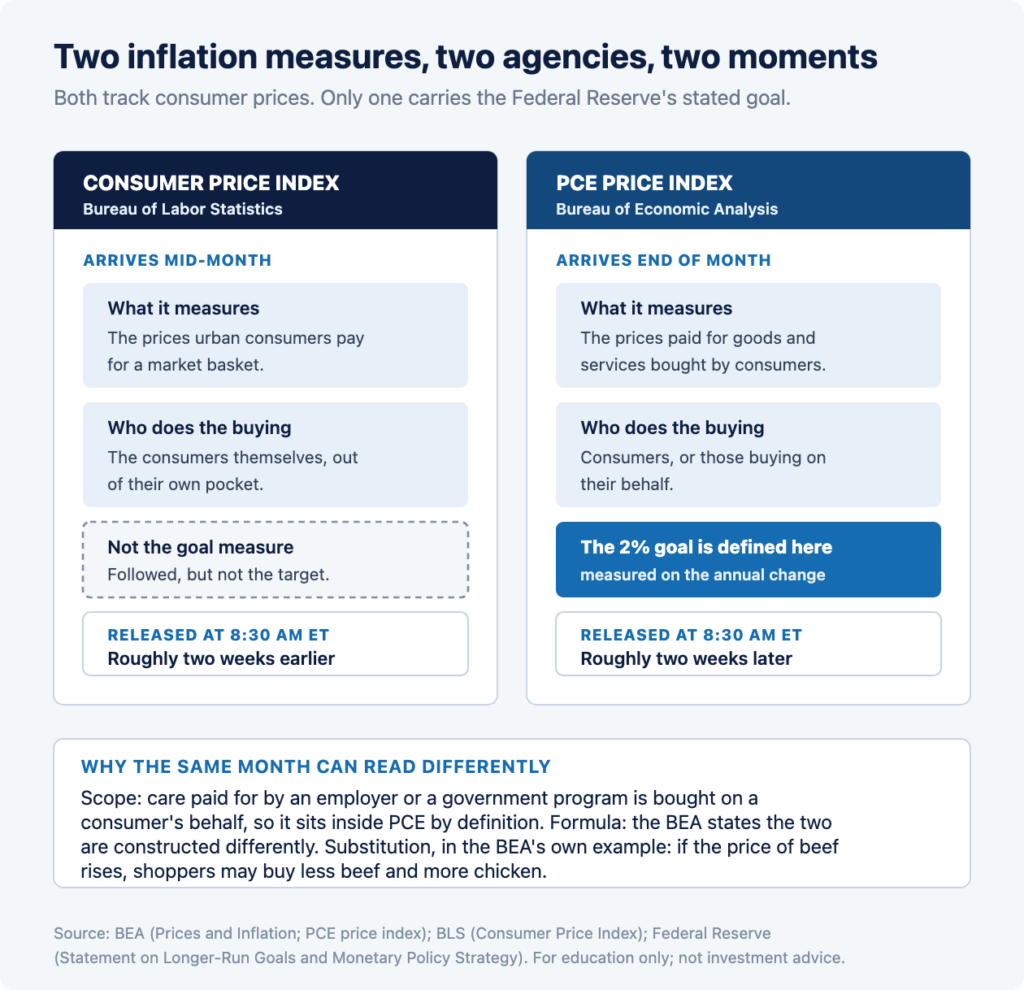
The Fed’s numerical inflation goal is defined on PCE, not on the Consumer Price Index. [7] The CPI is also followed in connection with rate expectations, as it arrives roughly two weeks earlier in the month and is commonly described as an early read on consumer prices. But the figure against which the Committee’s own 2 percent goal is measured is the one the BEA publishes at the end of the month. Our CPI report guide covers that earlier release in the same detail.
Where the target range stands
As of July 17, 2026, the federal funds target range is 3.50 percent to 3.75 percent, per Federal Reserve data carried by FRED, and it has stood at that range since December 2025. [8] Each PCE print becomes part of the evidence the Committee weighs against its 2 percent goal.
PCE vs CPI: why the same month reads differently
PCE and CPI are frequently compared, and the agencies that publish them document the differences directly. The two indexes measure overlapping but different things, using different formulas, and the BEA states plainly that they “have their own purposes and uses, are constructed differently, resulting in different inflation rates.” [6] Three differences account for much of the gap.
Scope
CPI measures the prices urban consumers pay for a market basket of goods and services, per the BLS. [12] PCE measures the prices paid by people living in the United States or by those buying on their behalf, per the BEA. [4] Health care is a concrete example of where that distinction bites. Medical care paid for by an employer or by a government program is a purchase made on a consumer’s behalf, so it sits inside PCE’s stated scope by definition. An index built around what urban consumers themselves pay accounts for that same care differently.
Weighting and formula
The two indexes weight their baskets differently and are calculated differently. [6] PCE is published as a chain-type index, and its weights update as spending patterns shift. The practical result is that the same underlying price movements produce different index changes.
Substitution
This one has an official example. The BEA notes that the PCE price index is known for “reflecting changes in consumer behavior,” and gives this illustration: “if the price of beef rises, shoppers may buy less beef and more chicken.” [6] PCE’s formula allows the basket to reflect that switch. An index that holds its basket fixed for longer will not capture the substitution as quickly, and will read differently as a result.
The reconciliation is a published document
For anyone who wants the arithmetic rather than the summary, the BEA publishes a research paper, “A Reconciliation between the Consumer Price Index and the Personal Consumption Expenditures Price Index,” which works through the sources of the gap directly. [9]
How is PCE trending? (13-month history)
Over the 13 months through May 2026, the 12-month headline rate moved from 2.5 percent to 4.1 percent, with most of the increase arriving from March 2026 onward. The core rate moved over the same window from 2.8 percent to 3.4 percent, a narrower range. [5]
| Month | Headline MoM | Headline 12-month | Core MoM | Core 12-month |
| May 2026 | +0.4% | 4.1% | +0.3% | 3.4% |
| Apr 2026 | +0.4% | 3.8% | +0.3% | 3.3% |
| Mar 2026 | +0.7% | 3.5% | +0.3% | 3.3% |
| Feb 2026 | +0.4% | 2.9% | +0.4% | 3.0% |
| Jan 2026 | +0.3% | 2.9% | +0.4% | 3.1% |
| Dec 2025 | +0.3% | 2.9% | +0.3% | 3.0% |
| Nov 2025 | +0.2% | 2.8% | +0.2% | 2.8% |
| Oct 2025 | +0.2% | 2.7% | +0.2% | 2.8% |
| Sep 2025 | +0.3% | 2.8% | +0.2% | 2.8% |
| Aug 2025 | +0.3% | 2.7% | +0.2% | 2.9% |
| Jul 2025 | +0.2% | 2.6% | +0.2% | 2.9% |
| Jun 2025 | +0.3% | 2.6% | +0.3% | 2.8% |
| May 2025 | +0.2% | 2.5% | +0.2% | 2.8% |
Reading the two columns together
The monthly and 12-month columns answer different questions. They can point in different directions in the same month. The 12-month rate compares the index with its level a year earlier, so it keeps rising as long as incoming months are larger than the months dropping out of the window. That is why the headline 12-month rate kept climbing from March through May 2026 even though the monthly changes over that stretch were not accelerating.
Why does PCE get revised?
A PCE figure is not necessarily fixed once published. The BEA states directly that it “revises previously published PCE data to reflect updated information or new methodology, providing consistency across decades of data that’s valuable for researchers.” [6]
A live example
The March 2026 core reading is a concrete case. In the release published April 30, 2026, the BEA reported the core PCE price index up 3.2 percent from a year earlier. [10] In the current published vintage of the series, that same March 2026 core reading stands at 3.3 percent. [5] Nothing was wrong with either figure. The estimate was updated as better source data arrived, exactly as the BEA describes.
Why it matters when reading history
A table of PCE history assembled today will not always match the numbers that were on the screen on release morning. This page’s trend table uses the current vintage and says so in its caption. When comparing a historical PCE figure against how markets behaved at the time, the number market participants actually saw that morning was the first print, not the revised one.
The annual update
The BEA has announced that the 2026 annual updates of the national, industry and regional accounts will all begin on September 30, 2026, which the agency notes is the first time the three have started on the same day. The update of the National Economic Accounts covers GDP, monthly personal income and outlays, and related statistics. [1] The annual update revises previously published estimates across the accounts, not only the most recent month.
How have PCE releases coincided with moves in rate expectations?
One way to observe how the market absorbed a release is the 2-year Treasury yield, which is viewed by market participants as a prominent indicator of near-term rate expectations. The table below shows where the 2-year yield settled in the sessions around the last three PCE releases.
These moves reflect several drivers, not the PCE release alone, and are shown here as history rather than as an indication of what any future release will do.
| Release date (data month) | Session before | Release day | Session after |
| Jun 25, 2026 (May data) | 4.11 | 4.09 | 4.07 |
| May 28, 2026 (Apr data) | 4.00 | 3.99 | 3.98 |
| Apr 30, 2026 (Mar data) | 3.92 | 3.88 | 3.88 |
What the table does and does not show
Across these three releases, the 2-year yield settled slightly lower on the release day than the session before in each case. That is an observation about three data points, not a pattern with predictive content, and each of those sessions contained many other pieces of news. A single scheduled release is one input among many, and the direction of a move on any future release day is not knowable in advance.
What else is scheduled for the morning of July 30
The June PCE figure arrives in the same window as two other scheduled events. The calendar for that week is published in advance by the BEA and the Federal Reserve.
The day after the Fed
The FOMC meets July 28 and 29, 2026, with the policy decision on the 29th. [11] The June PCE figure lands the following morning. The sequence means the Committee will have made its July decision before this inflation reading is public, and the reading then becomes the first major inflation data point of the new intermeeting period. Our guide to Fed decision day covers the mechanics of the meeting itself.
Two BEA releases at once
At the same 8:30 a.m. ET moment on July 30, the BEA also publishes the advance estimate of second-quarter GDP. [3] Both releases are published at the same minute and cover different subject matter: consumer prices and economic growth.
The wider window
The last week of July also carries a corporate earnings calendar. The result is a stretch in which macro data and company results overlap, and in which any single market move may reflect several simultaneous drivers.
How the market commonly reads PCE morning
A common observation about scheduled data releases is that price moves are generally associated less with the level of the number than with its distance from what was already expected. Ahead of each release, economists publish consensus estimates for the headline and core figures, and market participants generally regard those expectations as reflected in prices before 8:30 a.m. ET. A reading close to consensus can pass with little reaction; readings further from consensus have coincided with larger repricing.
The core and headline split
The two figures can tell different stories in the same month, and market commentary generally distinguishes between them. The Federal Reserve’s goal is stated on the total index rather than the core one, while the core index is the one the BEA describes as closely watched by the Fed for reading the underlying trend. Both numbers are commonly reported and discussed on release morning. [6] [7]
The premarket session
Because the release is premarket, the first reaction appears in index futures and premarket equity trading, where liquidity is limited and spreads are typically wider than in regular hours. Fast moves in both directions, and reversals as participants read the detail underneath the headline, are common in the first minutes after a print. Those conditions carry thinner liquidity and wider spreads than the regular session, and trading them involves substantial risk. Most day traders lose money. General risk-control concepts are covered on our position sizing and risk controls page.
Where to read the release itself
The primary document is published on the BEA website at the moment of release. The release itself carries the components, the technical notes, and the revisions to prior months, which a summary may not reproduce.
Risks and limitations
Several limitations apply to everything above, and they are worth stating plainly.
- The next print is not knowable. Nothing on this page forecasts the June figure. Consensus estimates are published by third parties and are themselves frequently wrong.
- Historical reactions do not repeat. The yield table shows what happened around three specific releases. Markets respond to many simultaneous drivers, and a similar print can produce a different reaction in a different context.
- The figures get revised. As set out above, a PCE reading can change after publication. [6]
- Scheduled data is a high-risk trading environment. The reaction is compressed into seconds, in a premarket session with thin liquidity and wide spreads. Prices can move sharply against a position immediately. Most day traders lose money, and leverage amplifies both gains and losses, meaning you can lose more than you deposit.
- This is not advice. Nothing here is a recommendation to trade any instrument, at any time, around any event.
What comes next
The next PCE figure lands July 30, 2026, at 8:30 a.m. ET, covering June data, alongside the advance estimate of second-quarter GDP, and the morning after the July FOMC decision. [3] [11] The open question after May is whether the 12-month headline rate, at 4.1 percent, continues to diverge from the core rate at 3.4 percent, or whether the two converge. [1] Both figures form part of the evidence the Federal Reserve weighs against its 2 percent longer-run goal, which is defined on this index. [7] This page will update with the June print and the refreshed tables after the release.
Frequently asked questions
What time is the PCE report released?
The PCE price index is released at 8:30 a.m. Eastern Time inside the BEA’s monthly Personal Income and Outlays report. That is one hour before the regular U.S. equity session opens at 9:30 a.m. ET, so the first reaction appears in index futures and premarket trading rather than the regular session.
When is the next PCE report?
The next release is Thursday, July 30, 2026, at 8:30 a.m. ET, covering June 2026 data. It arrives at the same moment as the BEA’s advance estimate of second-quarter GDP, and the morning after the July 28 to 29 Federal Open Market Committee decision. The release after it is August 26, 2026.
What did the last PCE report show?
In the report published June 25, 2026, covering May 2026, the PCE price index rose 0.4 percent on the month and 4.1 percent from a year earlier. Excluding food and energy, it rose 0.3 percent on the month and 3.4 percent over the year, according to the Bureau of Economic Analysis.
Does the Federal Reserve target CPI or PCE?
The Federal Open Market Committee judges that inflation of 2 percent over the longer run, as measured by the annual change in the price index for personal consumption expenditures, is most consistent with its mandate. The goal is defined on PCE. CPI is a separate measure published by a different agency.
What is the difference between PCE and CPI?
They measure overlapping but different things. CPI covers out-of-pocket spending by urban consumers; PCE also counts purchases made on a consumer’s behalf, such as employer-paid health care. The BEA states the two indexes are constructed differently, which results in different inflation rates.
What is core PCE?
Core PCE is the PCE price index excluding food and energy. The BEA describes it as making the underlying inflation trend easier to see, because food and energy prices tend to swing more dramatically and more often than other prices, and notes it is closely watched by the Federal Reserve.
Is the PCE price index revised?
Yes. The BEA revises previously published PCE data to reflect updated information or new methodology. A figure reported on release morning can be different from the same figure in the series a few months later, which is why historical comparisons should state which vintage they use.
Where can I read the official PCE release?
On the Bureau of Economic Analysis website. The monthly release is published at bea.gov under Personal Income and Outlays, and the forward schedule is at bea.gov/news/schedule. Reading the release itself rather than a summary shows the components, the technical notes, and the revisions to prior months, which a headline figure alone does not carry.
References
[1] U.S. Bureau of Economic Analysis, “Personal Income and Outlays, May 2026,” BEA 26-31, released June 25, 2026. https://www.bea.gov/news/2026/personal-income-and-outlays-may-2026
[2] New York Stock Exchange, “Hours and Calendars.” https://www.nyse.com/trade/hours-calendars
[3] U.S. Bureau of Economic Analysis, “Release Schedule,” retrieved July 17, 2026. https://www.bea.gov/news/schedule
[4] U.S. Bureau of Economic Analysis, “Personal Consumption Expenditures Price Index,” retrieved July 17, 2026. https://www.bea.gov/data/personal-consumption-expenditures-price-index
[5] Federal Reserve Bank of St. Louis (FRED), PCE price index series PCEPI and PCEPILFE (BEA data), retrieved July 17, 2026. https://fred.stlouisfed.org/series/PCEPI
[6] U.S. Bureau of Economic Analysis, “Prices & Inflation,” Learning Center, retrieved July 17, 2026. https://www.bea.gov/resources/learning-center/what-to-know-prices-inflation
[7] Board of Governors of the Federal Reserve System, “Why does the Federal Reserve aim for inflation of 2 percent over the longer run?” last updated August 22, 2025. https://www.federalreserve.gov/faqs/economy_14400.htm
[8] Federal Reserve Bank of St. Louis (FRED), federal funds target range, series DFEDTARU and DFEDTARL, retrieved July 17, 2026. https://fred.stlouisfed.org/series/DFEDTARU
[9] U.S. Bureau of Economic Analysis, “A Reconciliation between the Consumer Price Index and the Personal Consumption Expenditures Price Index.” https://www.bea.gov/research/papers/2007/reconciliation-between-consumer-price-index-and-personal-consumption
[10] U.S. Bureau of Economic Analysis, “Personal Income and Outlays, March 2026,” released April 30, 2026. https://www.bea.gov/news/2026/personal-income-and-outlays-march-2026
[11] Board of Governors of the Federal Reserve System, “FOMC Meeting Calendars.” https://www.federalreserve.gov/monetarypolicy/fomccalendars.htm
[12] U.S. Bureau of Labor Statistics, “Consumer Price Index.” https://www.bls.gov/cpi/
Disclosures: Trading involves substantial risk and is not suitable for every investor. Capital is at risk and most day traders lose money. Leverage amplifies both gains and losses, and you can lose more than you deposit. Client accounts are not SIPC or FSCS insured. Extended-hours trading carries additional risk, including lower liquidity and wider spreads. This content is provided for information and education only, for self-directed traders. It is not investment advice or a recommendation of any security, strategy, or account type. Figures are sourced from the U.S. Bureau of Economic Analysis, the Board of Governors of the Federal Reserve System, and the Federal Reserve Bank of St. Louis (FRED) as dated above. See our full disclosures and policies.