
The Consumer Price Index (CPI) is released by the U.S. Bureau of Labor Statistics at 8:30 a.m. Eastern Time, generally in the second week of each month. The next release is scheduled for July 14, 2026, at 8:30 a.m. ET, covering June 2026 data. In the most recent report, May 2026 CPI rose 0.5% on the month and 4.2% over the year, with the energy index driving over sixty percent of the monthly increase, according to the BLS. [1]
Data on this page is current as of July 3, 2026. It is updated after each CPI release. This content is for information and education only and is not investment advice.
What time is the CPI report released?
The CPI report is released at 8:30 a.m. Eastern Time on its scheduled day, according to the Bureau of Labor Statistics release calendar. [2] That is one hour before the regular U.S. equity session opens at 9:30 a.m. ET, per NYSE market hours. [3] Because of that timing, the first market reaction to the number often appears in index futures and in premarket equity trading, not in the regular session.
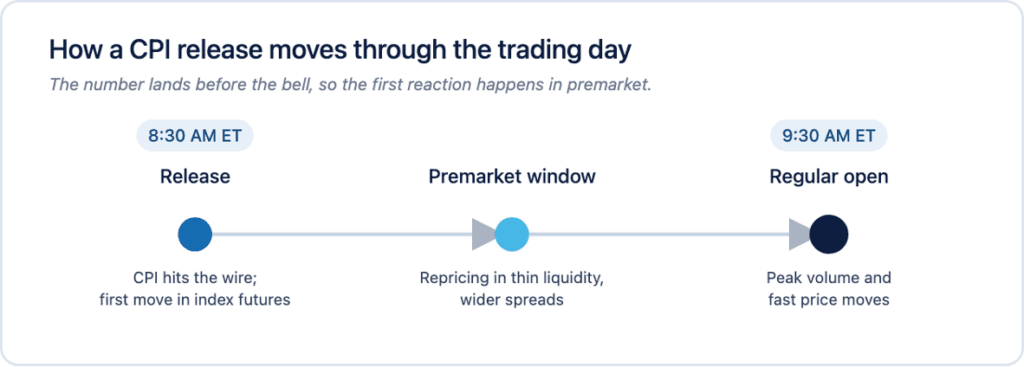
A CPI release lands an hour before the open, so the first reaction is in index futures and premarket trading, where liquidity is generally thinner than during regular trading hours.
One hour before the open
The release lands during premarket hours, so any repricing happens in a session where liquidity is typically thinner and bid-ask spreads are typically wider than in regular hours. The full report and data tables post to the BLS website (bls.gov) at the moment of release, and major data providers carry the headline figures within seconds.
Why the exact minute matters
For a scheduled data event, the reaction is compressed into the seconds after 8:30 a.m. ET. Knowing the precise time lets a trader decide in advance whether to be positioned before the print, to stand aside through it, or to wait for the regular open. Trading around scheduled data involves substantial risk, and prices can move sharply in either direction. Most day traders lose money.
When is the next CPI report? (2026 schedule)
The next CPI release is Tuesday, July 14, 2026, at 8:30 a.m. ET, covering June 2026 data. CPI is published monthly, generally in the second week of the month following the reference month. The remaining 2026 schedule, per the BLS release calendar: [2]
| Reference month | Release date | Time (ET) |
| June 2026 | July 14, 2026 | 8:30 a.m. |
| July 2026 | August 12, 2026 | 8:30 a.m. |
| August 2026 | September 11, 2026 | 8:30 a.m. |
| September 2026 | October 14, 2026 | 8:30 a.m. |
| October 2026 | November 10, 2026 | 8:30 a.m. |
| November 2026 | December 10, 2026 | 8:30 a.m. |
U.S. CPI release schedule, remaining 2026 (all 8:30 a.m. ET)
What did the last CPI report show?
The most recent release, published June 10, 2026 and covering May 2026, showed headline CPI up 0.5% on the month and 4.2% over the prior 12 months. Core CPI, which excludes food and energy, rose 0.2% on the month and 2.9% over the year. The energy index was the main driver, accounting for over sixty percent of the monthly all-items increase, per the BLS. [1]
The May 2026 numbers
- Headline CPI: +0.5% month-over-month (seasonally adjusted), after +0.6% in April. [1]
- Headline CPI: +4.2% over 12 months (not seasonally adjusted), up from +3.8% for the 12 months ending April. [1]
- Core CPI: +0.2% month-over-month and +2.9% over 12 months, versus +2.8% through April. [1]
What moved inside the report
The energy index rose 3.9% in May, after rising 3.8% in April and 10.9% in March, and it rose 23.5% over the 12 months ending May. Before seasonal adjustment, gasoline prices increased 8.6% in May. Shelter, the largest core category, rose 0.3%, and food rose 0.2% (food at home up 0.1%, food away from home up 0.3%). Not everything rose: the indexes for motor vehicle insurance, household furnishings and operations, and new vehicles were among the categories that decreased in May, and dairy fell 0.6% as cheese declined 2.9%. [1]
| Component | May monthly change | Note |
| Energy | +3.9% | over 60% of the monthly all-items increase; +23.5% over 12 months |
| Gasoline (before seasonal adj.) | +8.6% | the energy driver |
| Electricity | +0.6% | – |
| Natural gas | -0.5% | declined |
| Shelter | +0.3% | largest core weight |
| Food | +0.2% | food at home +0.1%, food away +0.3% |
| Dairy | -0.6% | cheese -2.9% |
| Motor vehicle insurance | decreased | a core decliner |
| New vehicles | decreased | – |
May 2026 CPI: selected component changes (source: BLS, released 2026-06-10)
What is CPI and how is it measured?
The Consumer Price Index, compiled by the U.S. Bureau of Labor Statistics, measures the average change over time in the prices urban consumers pay for a market basket of goods and services, including housing, food, energy, transportation, medical care, and more. [1] Two figures get most of the attention on release day.
Headline vs core
Headline CPI is the all-items index. Core CPI removes food and energy, the two most volatile categories, and is often treated as the steadier read on underlying inflation. Traders watch both because they can tell different stories in the same month.
Seasonally adjusted vs not
The BLS reports monthly changes on a seasonally adjusted basis (which smooths predictable calendar patterns) and 12-month changes without seasonal adjustment. That is why a report can show a 0.5% monthly rise and a 4.2% annual rise at the same time: they measure different windows. [1]
Headline vs core CPI: why traders watch both
When headline and core diverge, the gap usually points to a volatile category doing the work, and May 2026 is a clean example: headline rose to a 4.2% annual pace while core held near 2.9%, because energy carried the headline number. A trader who reads only the headline can misjudge how the market will treat the underlying trend.
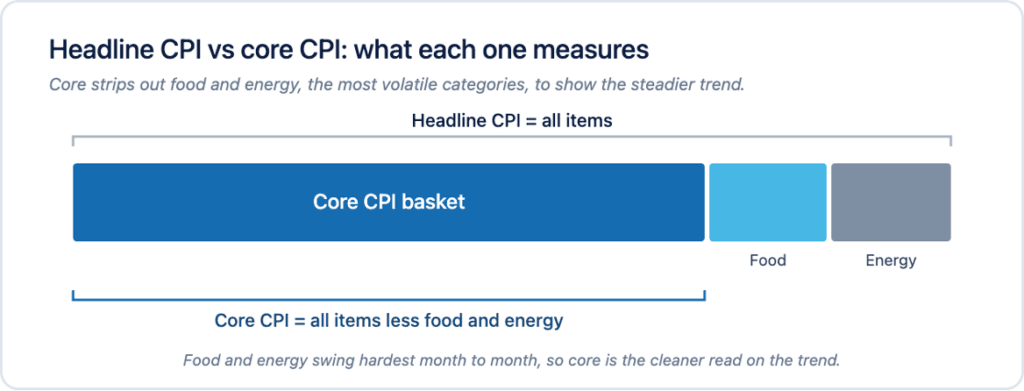
Headline CPI covers all items; core CPI removes food and energy, the two most volatile categories, to show the steadier trend.
The situation
Headline inflation is what most people feel at the pump and the grocery store. It is also the noisiest, because energy and food swing hard month to month.
The complication
A single category can dominate a print. In May, energy accounted for over sixty percent of the monthly all-items increase, and gasoline alone rose 8.6% before seasonal adjustment. [1] That can push the headline higher even when the broad trend, measured by core, is steadier.
The resolution
This is why the first market reaction often focuses on the core number and the surprise relative to expectations, not the headline level alone. Reading both figures, and the components underneath, gives a fuller picture of what the report actually said.
How is CPI trending? (13-month history)
Over the year through May 2026, annual headline CPI troughed at 2.4% in February and reaccelerated to 4.2% by May, an energy-led move. Core inflation stayed in a narrower band, easing from the low-3% area in mid-2025 toward 2.9% by May 2026. The monthly figures show the same story: larger headline gains in March through May coincided with the energy rebound. [4]
| Month | Headline MoM | Headline YoY | Core MoM | Core YoY |
| May 2026 | +0.5% | 4.2% | +0.2% | 2.9% |
| Apr 2026 | +0.6% | 3.8% | +0.4% | 2.8% |
| Mar 2026 | +0.9% | 3.3% | +0.2% | 2.6% |
| Feb 2026 | +0.3% | 2.4% | +0.2% | 2.5% |
| Jan 2026 | +0.2% | 2.4% | +0.3% | 2.5% |
| Dec 2025 | +0.3% | 2.7% | +0.2% | 2.6% |
| Nov 2025 | +0.3% | 2.7% | +0.2% | 2.6% |
| Sep 2025 | +0.3% | 3.0% | +0.2% | 3.0% |
| Aug 2025 | +0.3% | 2.9% | +0.3% | 3.1% |
| Jul 2025 | +0.2% | 2.7% | +0.3% | 3.1% |
| Jun 2025 | +0.3% | 2.7% | +0.2% | 2.9% |
CPI 13-month trend: monthly change (seasonally adjusted) and 12-month change (not seasonally adjusted). Source: FRED series CPIAUCSL, CPILFESL, CPIAUCNS, CPILFENS, retrieved 2026-07-03.
Note: the October 2025 monthly point is omitted here because of a release-timing gap in the published series. Figures are the official BLS releases as carried by FRED.
How does CPI connect to the Fed and interest rates?
CPI feeds directly into expectations for Federal Reserve policy, which is why it moves rate-sensitive markets. The Federal Reserve targets 2% inflation over the longer run, measured by the price index for personal consumption expenditures (PCE), not CPI itself, according to the Fed. [5] CPI still matters to markets because it arrives earlier in the month than PCE and shapes expectations in the meantime.
Where rates stand
As of July 3, 2026, the federal funds target range is 3.50% to 3.75%, per Federal Reserve data carried by FRED. [6] Each CPI print is read as evidence for or against the path of future rate moves, and that read is what markets reprice.
CPI vs PCE
The two measures use different baskets and weights, so they can diverge. A trader tracking Fed expectations watches CPI for the early signal and PCE for the gauge the Fed actually targets.
How CPI fits with PPI, PCE and the jobs report
CPI is one of several scheduled releases that move rate expectations, and traders read them together. The Producer Price Index (PPI) measures prices at the wholesale level and often previews pipeline pressure; the PCE price index is the Fed’s preferred inflation gauge; and the monthly jobs report (the Employment Situation) covers the other half of the Fed’s mandate. All are released at 8:30 a.m. ET on their scheduled days.
The releases around this CPI
For the current cycle, the sequence of major releases after this CPI is close together, so a trader planning the month can map them in advance:
| Release | What it measures | Next date |
| CPI (June data) | consumer prices | Jul 14, 2026 |
| PPI (June data) | producer / wholesale prices | Jul 15, 2026 |
| Retail sales (June) | consumer spending | Jul 16, 2026 |
| PCE price index | the Fed’s preferred inflation gauge | Jul 30, 2026 |
| Employment Situation (jobs) | payrolls + unemployment | Aug 7, 2026 |
Selected upcoming U.S. data releases (8:30 a.m. ET). Sources: BLS (CPI, PPI, Employment Situation), BEA (PCE), release calendars retrieved 2026-07-03.
Reading them together
CPI and PPI arrive a day apart, so the market often treats them as a pair: a hot CPI followed by a soft PPI can temper the first reaction, and vice versa. PCE later in the month is the figure the Fed actually targets, so a CPI print can shift expectations that PCE then confirms or contradicts. The jobs report covers employment, the other side of the Fed’s dual mandate. Our Knowledge Hub covers the market fundamentals behind these releases, and each has its own guide.
How does the CPI report move markets?
What moves prices on CPI morning is generally not the number itself but the number relative to expectations. A print in line with consensus can pass quietly, while a meaningful surprise tends to reprice rate expectations, and with them index futures, Treasury yields, and rate-sensitive sectors, within seconds of 8:30 a.m. ET.
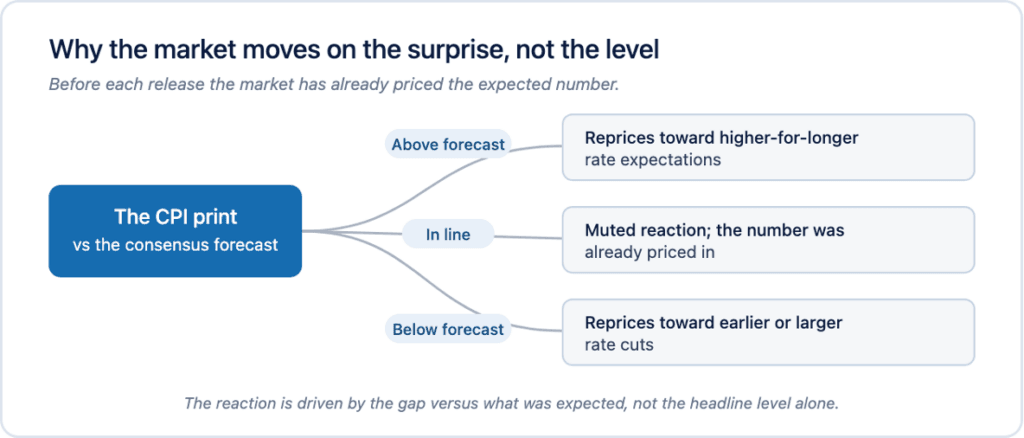
Markets have already priced the expected number, so it is the surprise versus consensus that drives the move, not the headline level alone.
The surprise, not the level
Ahead of each release, economists publish consensus forecasts for headline and core CPI. The market has already priced the expected number, so it is the gap between the print and consensus that drives the move. This is why a “high” inflation number can sometimes see markets rally, if the print came in below what was feared.
Reading the rate reaction
One way to see the repricing is the 2-year Treasury yield, which tracks near-term Fed-rate expectations. The table below shows the 2-year yield in the sessions around the last three releases. These moves reflect several drivers, not CPI alone, and are shown here as history, not as a prediction of any future release.
| Release (data month) | Day before | Release day | Day after |
| Jun 10, 2026 (May data) | 4.13 | 4.13 | 4.05 |
| May 13, 2026 (Apr data) | 4.00 | 3.98 | 4.00 |
| Apr 10, 2026 (Mar data) | 3.78 | 3.81 | 3.78 |
2-year Treasury yield (%) around recent CPI releases. Source: FRED series DGS2, daily, retrieved 2026-07-03. Shown as historical context, not a forecast.
Longer-dated rates move too
The 10-year Treasury yield, which influences mortgage rates and long-duration equity valuations, also responds. In the sessions around the June 10 release, the 10-year yield moved from 4.55% on June 10 to 4.45% on June 11, per FRED. [4] Like the 2-year, this reflects several drivers and is shown as history, not a prediction of any future release.
Where it lands first
Because the release is premarket, the first reaction often appears in index futures and premarket equity trading, in a session with thinner liquidity and wider spreads. Fast moves in both directions, and quick reversals as the market digests the core-versus-headline detail, are common in the first minutes after the print. Trading these conditions involves substantial risk, and most day traders lose money.
What do active traders watch on CPI morning?
On CPI morning, active traders generally focus on the print versus consensus for both headline and core, the split between the two, the reaction in index futures and rate-sensitive names premarket, and the elevated volatility around the 9:30 a.m. ET open. None of these is a signal to buy or sell; they are what participants monitor.
The watch list
1. The print versus consensus, for both headline and core. The surprise, not the level, is what repricing keys off.
2. The core/headline split. As in May, one component such as energy can drive the headline while core tells a steadier story. [1]
3. Index futures and rate-sensitive names in premarket, the first read on how expectations are shifting.
4. Volatility around the open. The 9:30 a.m. ET open after a surprise print often sees elevated volume and fast movement, conditions in which order type and risk controls matter.
Trading around scheduled economic data carries substantial risk: markets can move sharply and unpredictably in either direction, premarket liquidity is limited, and most day traders lose money. Nothing here is a recommendation to trade any instrument or around any event.
How do you prepare to trade a scheduled data release?
Preparation for a scheduled release like CPI is mostly about knowing the exact time, understanding that the premarket session behaves differently from regular hours, and controlling risk in advance. The mechanics below are educational and are not advice to trade the event.
Know the session you are trading
The reaction begins at 8:30 a.m. ET, an hour before the regular open. Trading it means trading the premarket session, where spreads are typically wider and liquidity thinner than regular hours, so fills can be less predictable. CMEG provides extended-hours access on its platforms; extended-hours trading carries added risk, and you can lose more than you deposit. You can review the session hours and extended-hours risks in our FAQs.
Consider using order types that manage the risk
In thin, fast premarket conditions, market orders can fill far from the last price. Limit orders and stop orders are the common tools for controlling entry and exit. Position sizing and risk controls typically matter more than usual when a single data point can move the tape quickly.
Have a plan before 8:30
Because the move is compressed into seconds, decisions made in real time are harder. Traders typically decide in advance whether to be positioned into the print, to stand aside, or to wait for the regular open. Whatever the choice, the risk that the market moves against a position, sharply and immediately, is real.
What to watch into the next release
The next CPI report lands July 14, 2026, at 8:30 a.m. ET, covering June data. The open questions after May are whether energy keeps driving the headline higher and whether core holds near 2.9%. Both figures feed the market’s read on the Fed’s rate path, which currently sits at a 3.50% to 3.75% target range. [6] This page will update with the June print and the refreshed component detail after the release. As always, the material here is for information only and is not investment advice.
Frequently asked questions
What time is the CPI report released?
CPI is released at 8:30 a.m. Eastern Time on its scheduled day, per the BLS release calendar, one hour before the regular U.S. equity session opens at 9:30 a.m. ET.
When is the next CPI report?
The next release is July 14, 2026, at 8:30 a.m. ET, covering June 2026 data. CPI is published monthly, generally in the second week of the month.
How often is the CPI report released?
Monthly. The BLS publishes CPI for the prior reference month, generally in the second week of the following month, at 8:30 a.m. ET.
What did the last CPI report show?
May 2026 (released June 10, 2026): headline CPI rose 0.5% on the month and 4.2% over 12 months; core rose 0.2% and 2.9%. Energy accounted for over sixty percent of the monthly increase, per the BLS.
What is the difference between headline and core CPI?
Headline CPI is the all-items index. Core CPI excludes food and energy, the most volatile categories, and is often treated as a steadier read on underlying inflation. Markets watch both.
Does the Federal Reserve target CPI or PCE?
The Fed targets 2% inflation over the longer run measured by the PCE price index, not CPI. CPI still moves markets because it is released earlier and shapes rate expectations in the meantime.
Where can I read the official CPI release?
On the Bureau of Labor Statistics website: the release at bls.gov/news.release/cpi.nr0.htm and the schedule at bls.gov/schedule/news_release/cpi.htm.
References
[1] U.S. Bureau of Labor Statistics, “Consumer Price Index Summary, 2026 M05 Results,” released June 10, 2026. https://www.bls.gov/news.release/cpi.nr0.htm
[2] U.S. Bureau of Labor Statistics, “Schedule of Releases for the Consumer Price Index.” https://www.bls.gov/schedule/news_release/cpi.htm
[3] New York Stock Exchange, “Hours and Calendars.” https://www.nyse.com/markets/hours-calendars
[4] Federal Reserve Bank of St. Louis (FRED), CPI series CPIAUCSL, CPILFESL, CPIAUCNS, CPILFENS, retrieved July 3, 2026. https://fred.stlouisfed.org/series/CPIAUCSL
[5] Board of Governors of the Federal Reserve System, “Why does the Federal Reserve aim for inflation of 2 percent over the longer run?” https://www.federalreserve.gov/faqs/economy_14400.htm
[6] Federal Reserve Bank of St. Louis (FRED), federal funds target range, series DFEDTARU and DFEDTARL, retrieved July 3, 2026. https://fred.stlouisfed.org/series/DFEDTARU
Disclosures: Trading involves substantial risk and is not suitable for every investor. Capital is at risk and most day traders lose money. Leverage amplifies both gains and losses, and you can lose more than you deposit. Client accounts are not SIPC or FSCS insured. Extended-hours trading carries additional risk, including lower liquidity and wider spreads. This content is provided for information and education only. It is not investment advice or a recommendation of any security, strategy, or account type. Figures are sourced from the U.S. Bureau of Labor Statistics, the Federal Reserve, and the Federal Reserve Bank of St. Louis (FRED) as dated above. See our full disclosures and policies.